Holographic Subsurface Radar: Technology and Application
Sergey I. Ivashov1, Vladimir V. Razevig1, Igor
A. Vasiliev1, Andrey V. Zhuravlev1
Timothy D. Bechtel2, Lorenzo Capineri3,
1Bauman Moscow State Technical University, Russia
2Franklin & Marshall College, PA, USA,
3the University of Florence, Italy
Received October 28, 2010
Abstract. Holographic subsurface radars (HSR) are not in common usage now; possibly because of the historical view amongst radar practitioners that high attenuation of electromagnetic waves in most media of interest will not allow sufficient depth of penetration. It is true that the fundamental physics of HSR prevent the possibility to change receiver amplification with time (i.e. depth) to adapt to lossy media (as is possible with impulse subsurface radar or ISR). However, use of HSR for surveying of shallow subsurface objects, defects, or inhomogeneities is an increasingly proven area of application. In this case, HSR can record images with higher resolution than is possible for ISR images. The RASCAN family of holographic radars is presented along with technical specifications and typical case histories. Among the applications considered are civil and historic building surveys, non-destructive testing of dielectric materials, security applications, and humanitarian demining. Each application area is illustrated by relevant data acquired in laboratory experiments or field tests. This paper presents experiments with RASCAN imaging in media with different degrees of attenuation, and illustrates the principle of HSR through an optical analogy.
Keywords: holographic subsurface radar, humanitarian demining, impulse subsurface radar, lossy medium, non-destructive testing, optical analogy, security applications.
I. INTRODUCTION
In their early days of development (1970s and 1980s), subsurface radars were considered an electromagnetic technique for detection of subsurface objects at depths of a few meters. This was a result of the frequency range of 100-500 MHz, which was accessible at the time [1, 2]. Depth resolution in this band was restricted to 0.5-1 m, and the main media under consideration at that time were soils and glacial ice. It was these applications that gave the name of Ground Penetrating Radar (GPR) to this early type of radar. The abbreviation is still in wide use despite the fact that modern subsurface radars have much wider areas of application, deserving of the more accurate name of surface-penetrating radar [3].
All types of GPR can be divided into three categories in accordance with the characteristics of emitted signal [3]:
· Time-domain impulse radars
· Frequency-modulated continuous-wave radars
· Holographic radars.
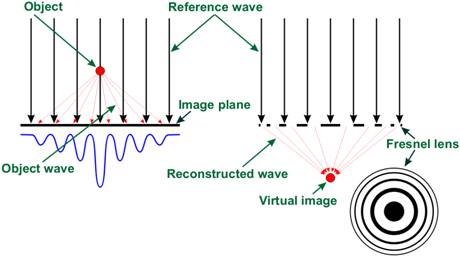
The last type of subsurface radar is the topic of this work. Holographic subsurface radar differs from the two other types of GPR in the requirement for plan-view scanning of a surface to record subsurface radar holograms. In this sense HSR is analogous to the optical hologram technology first proposed and accomplished by D. Gabor in 1948 [4]. The method proposed by Gabor can be simply illustrated by means of an example of a point object hologram recording. An axially symmetric hologram of a point object could be recorded on a flat plate as the interference pattern between a coherent plane wave with constant phase that is perpendicular to the plate, and waves that are scattered by a point object. A schematic representation of Gabor’s optical holography method for a point object is shown in Fig. 1 [4, 5].
The plate that records the interference pattern of waves is called a hologram. Unlike an optical photograph, the microwave hologram could record not only the intensity of the waves scattered by the object, but also information on the phase of these waves. When the optical hologram is illuminated by coherent light with the same wavelength used for recording, a virtual three-dimensional image of the object is projected on the other side of the screen. In the case of a point object, the hologram represents a Fresnel lens, and the projected or restored object is simply the point itself (see Fig. 1).
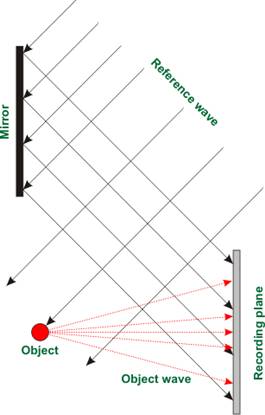
Gabor’s method of hologram recording has many disadvantages in terms of hologram quality and convenience of its application [6]. A new step in the development of holography was made by E.N. Leith, and J. Upatnieks after the invention of the laser [7]. In their paper, a method using a coherent light beam at an angle to the recording plate was proposed. A diagram of this type of holography is presented in Fig. 2. Subsequent innovations in optical holography have involved the use of different combinations of mirrors and beamsplitters.
While the experimental configuration of Leith and Upatnieks, using an inclined reference wave, is the basis for modern optical holography, it is scarcely possible to implement this for subsurface radar because of the high level of attenuation for electromagnetic waves in most media of interest (lossy media).
|
|
|
Fig. 2. Diagram of optical hologram with an inclined light beam. |
Nevertheless, holographic technology has found vast applications in radiolocation. For example, holographic radars have been designed for detection of weapons concealed on human bodies in airports [8]. Radar holography in the atmosphere or outer space also has many features in common with optical holography because of the absence or very low level of electromagnetic attenuation and dispersion in these media.
The main difference between optical holography and subsurface radar holography is the relative dimensions of the recording systems in the two cases. For optical holography, a size-to-wavelength ratio of d/l @ 106 applies (where l is wavelength and d is a representative dimension of the system). The same parameter for HSR is equal to only a few units. Thus, propagation of light rays as in Figs. 1 and 2, which obeys the laws of geometrical optics, cannot be simply applied for HSR implementation. So, it is possible to construct only a rough analogy between processes in optical holography and HSR. Nevertheless, the analogy is critical for understanding of the physical processes of HSR and for interpretation of HSR holograms.
Subsurface holographic radars are designed for surveying heterogeneous media with relatively high levels of attenuation, and sometimes with high dispersion also. The latter property may have great influence on the recording of multi-frequency holograms. As experiments have shown, all of these factors degrade the quality of microwave holograms, and in many cases make it impossible to record holograms themselves. Theoretical explanations of the influence of media properties on the quality of subsurface holograms have recently been discussed by N. Chubinsky [6]. Attenuation within media and heterogeneities on the surface restrict the maximal effective depth of penetration for HSR [9]. It is important to stress that ISR has a distinct advantage over HSR in terms of effective penetration depth due to the possibility to apply time-varying gain in a stroboscopic receiver to selectively amplify deeper reflections that have longer time-of-flight. Since time-of-flight is irrelevant to HSR, the main application of HSR is related to shallow depths.
At the shallow depths where it is applicable, the main advantage of HSR is the ability to record images that have higher resolution in the plane of search (or plan-view) in comparison with ISR. High plan-view resolution at shallow depths is extremely important for many applications, including:
· Searching for hidden bugging devices [5]
· Diagnostics of building details and constructions [12, 13]
· Diagnostics of composite materials [14, 15].
The simplest way to design holographic subsurface radar is to use a coupling signal between the transmitter and receiver antennae as the reference signal [6]. The main problem is the need to design an antenna appliance that could guarantee the independence of the phase of this reference signal from properties of the sounding surface and heterogeneities in the medium. To achieve this goal, all HSR antennae of the RASCAN type described below are placed in an open waveguide.
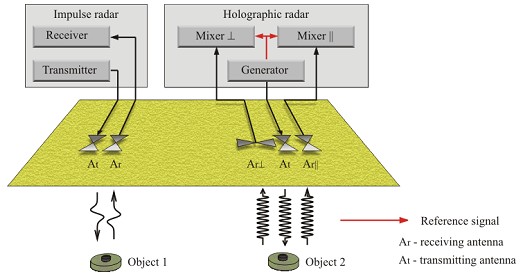
In Fig. 3, the schemes of impulse and holographic subsurface radars are compared. The holographic radar of RASCAN type consists of: antenna, transmitter and two receivers for parallel and cross polarizations [16]. RASCAN radars use continuous wave un-modulated signals, which are transmitted in a frequency band with a width of about 0.5 GHz at five discrete frequencies. The choice of operating frequency band and the number of frequencies is dictated by the necessity to provide a sufficient contrast between the object and medium for at least at one of the operating frequencies. It will be shown further, that in the case of a single frequency, for a given target there are “blind” depths at which the sensitivity of the holographic subsurface radar is minimal.
|
|
|
Fig. 3. Comparison of impulse and holographic radars schemes |
The comparison of parameters for impulse and holographic subsurface radars is presented in Table I. The main distinction between them is the type of frequency spectrum. Impulse radar has a continuous frequency spectrum with the form of emitted signals being close to one period of a sinusoid. Holographic radar, instead, has a discrete spectrum.
Table I
Comparison of Impulse and Holographic Subsurface Radars Parameters
|
Parameter |
Impulse Radar |
Holographic Radar |
Remarks |
|
Frequency spectrum |
Continuous |
Discrete |
|
|
Penetration depth |
Up to 10 λ |
1-2 λ |
λ – wavelength in air |
|
Resolution at shallow depths in plane of surveying |
> λ |
~ 0.25 λ |
λ – wavelength in air |
|
Surveying over metal substrate |
Hardly possible |
Possible |
|
|
Possibility of object’s depth measurement |
Directly from |
under investigation |
This task for holographic subsurface radar does not have a proper solution yet |
|
Adaptation to the FCC norms |
Difficult |
Easier |
Frequency spectrum of holographic radar could be selected in advance while impulse radar has a UWB spectrum that can’t be changed or limited arbitrarily |
|
Radar cost, USD |
15,000-45,000 |
~ 5,000 |
|
As mentioned above, a time-varying amplification in the stroboscopic receiver of the impulse radar provides higher amplification for deeper objects and endows the radar with its main advantage of high penetration depth. In contrast, since it is continuous wave, holographic radar has the same amplification for objects at all depths. In this case, penetration depth depends on attenuation in the surveying medium, and the magnitude of heterogeneities at shallow depths (since shallow heterogeneities may shade deeper objects in recorded images).
The HSR of RASCAN type is designed to have a ground coupled antenna system in order to keep small the antenna fingerprint and consequently a good lateral (plan–view) resolution. Moreover, reverberations from deep targets (deeper than 2 – 3 wavelengths) have little influence on the received signals since they are attenuated by the medium at the typical operating frequencies (see Table II and section II).
On the other hand, the ultra-wide spectrum of the emitted time-domain impulse is the main disadvantage of impulse radar. This can lead to interference with other microwave devices (global positioning and communications systems, electromagnetic switches or electro-explosive triggers, etc.), and as a consequence, also leads to conflict with existing standards for electromagnetic compatibility. In particular, it is worth mentioning the conflict that emerged in the USA in connection with the Federal Communication Commission (FCC) requirements that actually forbade the use of impulse subsurface radars [17, 18]. However, holographic radars are much easier to adapt to the US FCC regulations and other industrial and military demands, and also have the advantage that they are much cheaper to produce than impulse radars.
In addition, at shallow depths, the holographic radar of RASCAN type has a distinct advantage in resolution over impulse radars because of the specific design of the radar antenna that combines transmitter and receiver antennae into a single housing. Another extremely important advantage of holographic radar technology is the possibility to image without reverberation heterogeneous inclusions in dielectric materials that lie above, and even directly on, a metal surface. Such composite materials cannot currently be inspected non-destructively with traditional time-domain impulse radar technology. The reverberation of pulses between the impulse radar antenna and metal substrate obscures the actual location and shape of heterogeneities, defects, and other inclusions in the dielectric medium. Here, the object of interest is lost in multiple reflections (often called ghosts or phantoms) of the transmitted impulse signal [19]. Therefore, the unique ability of holographic radar to image objects on metal surfaces could be very important for non-destructive testing: for example the inspection of the heat protection systems of space vehicles. Experiments that support this application area are considered later in the paper.
II. Radar description
Three models of RASCAN holographic radar, with operating frequencies in range of 3.6 through 4.0 GHz; 1.6-2.0 GHz; and 6.4 – 6.8 GHz respectively, are now being produced (see Table II). The choice of a frequency range, and hence radar model, is determined by the conditions of a particular task and by the trade-off between spatial resolution and penetration depth. For higher operating frequency ranges, the spatial resolution improves but penetration depth falls. However, this is a common problem for all types of subsurface radars, and for all non-destructive testing or geophysical methods. It is important also to remark that for recording radar images with higher resolution, scanning with shorter intervals between lines is needed, requiring more time to scan a given area.
It is necessary to point to an essential distinction of the term “spatial resolution” when applied to impulse and holographic subsurface radars. For impulse radars, as a rule, the resolution is understood as the depth resolution and is defined by the duration of the emitted impulse. For holographic radars this term is determined by the resolution at shallow depths in the plane of view. The resolution in the latter case is defined by the operating frequency.
The antenna of holographic subsurface radar operates as the gauge of the electromagnetic waves in the near and reactive fields for object depths from zero level to a maximum sounding depth of 15-35 cm. To record a microwave hologram, the operator scans the surface under inspection line-by-line [20]. The scanning head is swept directly by hand, or using a special handle for the 1.6-2.0 GHz device. A parameter comparison for the three modifications of RASCAN radar is listed below in Table II. The high resolution in the plane of view for holographic subsurface radars of RASCAN type is explained by the focusing properties of the antenna at shallow depths.
Parameters of RACAN-4 Holographic Radars
|
Parameter |
Rascan-4/2000 |
Rascan-4/4000 |
Rascan-4/7000 |
|
Frequency range, GHz |
1.6 - 2.0 |
3.6 - 4.0 |
6.4 - 6.8 |
|
Number of operating frequencies |
5 |
||
|
Number of
recording |
2 |
||
|
Emitting power, W |
6·10-3 * |
||
|
Sensitivity
of |
10-9 |
||
|
Resolution
in the plane |
4 |
2 |
1.5 |
|
Maximal sounding depth (depends on medium permittivity), cm |
35 |
20 |
15 |
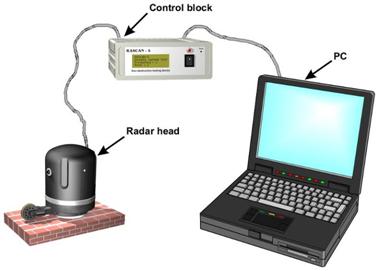
The RASCAN-4 design consists of an antenna head and control block that are connected by cable to a USB port of a computer, Fig. 4. The computer has no special requirements, requiring only that the radar software be installed. The computer is used for general radar control and the monitor displays in real time the images recorded by the radar. The main functions of control block are to supply power to the radar head and control the microwave circuitry in it.
|
|
|
Fig 4. Connection scheme of the RASCAN-4 radar parts with computer. |
III. Theoretical
Analysis and Explanations
A design innovation of the RASCAN-4 radars is in the implementation of a multi-frequency operational mode that simultaneously employs different discrete frequencies. The multi-frequency mode is essential for HSR because in monochromatic mode of operation, it is possible to miss objects at certain depths where, due to the sensitivity having sinusoidal dependence on the object depth, the recorded phase difference is the same as if no object is present [9]. However, with proper selection of frequency band, and simultaneous use of a number of frequencies, an object at arbitrary depth will appear in the hologram for at least one of the frequencies. Let us consider a mathematical model of the simplest monochromatic holographic subsurface radar. It can be presented as follows.
A subsurface object is approximated by a plane that is perpendicular to the incident electromagnetic wave. The radar radiates electromagnetic waves at a constant frequency ω whose amplitude and phase do not depend on time. The reflected wave has constant amplitude Ar , but the phase of the reflected wave φr depends on the range to the object
![]()
![]() , (1)
, (1)
where Dφ is the phase shift which arises upon reflection of the electromagnetic wave from the object, ε is the dielectric permittivity of the medium, l is the distance to the object, ω is the cyclic frequency, and c is the speed of light. Thus, the reflected signal depending on time t can be written as
Arcos(wt+ φr) (2)
Reflected wave (2) mixes with a constant-phase radar reference signal in form of
Aocos(wt+ φo), (3)
where Ao and φo are the amplitude and phase of the reference signal respectively. Then, the reflected signal (2) is mixed with the radar reference signal (3) in the mixer. The amplitude of signal in the mixer output at the difference frequency is given by
ArAocos(φo - φr). (4)
From this relation one can conclude that, if the phase shift between the reference signal and reflected one is close to
φo - φr=(k+1/2)π , k=0,1,2,… (5)
the level of recorded signal from the object is low, and at
φo - φr=kπ , k=0,1,2,… (6)
the recorded signal level is maximal. The latter circumstance was observed experimentally. To avoid “blind” depths it was proposed to use multifrequency signals with a bandwidth providing inversion of the object contrast with background for scanning within the chosen frequency range. This guarantees high contrast for an arbitrary object for at least one of working frequencies. The effect of differing contrast is demonstrated in an animation [21]. This animation recorded by RASCAN-4/2000 presents a multi-frequency hologram of an antitank mine in sand. Each frame of the animation corresponds to particular frequency of the radar.
IV. Experiments
To demonstrate the holographic nature of RASCAN radars, some experiments were performed. The microwave holograms in Fig. 5 presents results of scanning with a Rascan-4/4000 over a stack of dry plaster sheets in which several metal coins of 25-mm in diameter and two thin wires were placed at different depths between sheets. These pictures present two frequencies (4.0 and 3.6 GHz) from the grid of five operating frequencies. The holograms illustrate well the wavy nature of recorded images, and appearance of the images well coincides with the predicted form of a Fresnel lens in Fig. 1.
|
|
|
a) f=4.0 GHz |
|
|
|
b) f=3.6 GHz |
|
Fig. 5. Microwave images of coins and wires recorded by holographic radar RASCAN-4/4000 at two operating frequencies. |
One more effect that distinguishes holographic radar is the possibility to observe an object that is placed under another object. One coin in Fig. 5 that is visible in the top left corner of the image was placed under a wire at some distance below it. However the coin is visible in shadow of the wire. This is possible due to the difference in phase shifts of the reflected signal from objects located at different depths. This gives an opportunity to achieve higher contrast for one object or another by switching through frequencies in the selected bandwidth. In the first case f = 4 GHz, the frequency was chosen so that the contrast of the coin located at a greater depth was brighter than the wire. In the second case f = 3.6 GHz, the wire shades the coin more strongly. For a better representation of images at all five working frequencies, a computer animation in which the image at one frequency transforms smoothly into the image at the next frequency, and so on, is used [22]. So, the operator can evaluate the results of his work with the radar simultaneously at all frequencies.
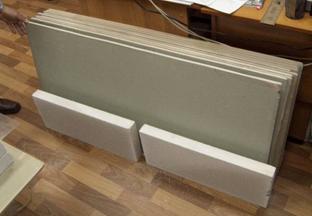
It was mentioned above that the main difference between optical and subsurface holograms is size-to-wavelength ratio that is much larger for optics systems than for subsurface microwaves. Characteristic system dimensions for subsurface radars are restricted by strong attenuation in most media of interest, and rarely may be more than 10 wavelengths. To demonstrate this difference, the next experiment was proposed. A stack of ten plaster sheets, Fig. 6, with dimensions of 60 by 125 cm, and thickness for each sheet of 1.2 cm, was placed horizontally.
|
|
|
Fig. 6. Photograph of ten plaster sheets (in the background) and two foam bricks that were used in experiments. |
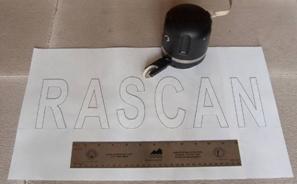
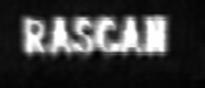
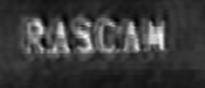
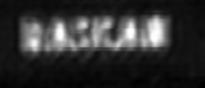
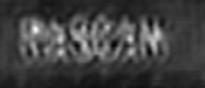
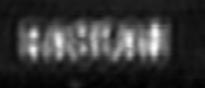
A sheet of paper with embedded letters was constructed. The letters were cut from thin aluminum foil. Dimensions of the word ‘RASCAN’ are 44 cm by 11.5 cm, Fig. 7. The paper sheet with aluminum lettering was placed on a plaster sheet, and was covered by other plaster sheets one-by-one. After addition of each new sheet to the stack, the hidden paper sheet was scanned by hand using the RASCAN-4/4000 radar. Every scan included simultaneous recording of ten radar holograms, at each of five discrete frequencies, and two polarizations per frequency. The dimensions of scanned area were equal to 65 cm by 28 cm.
Proper recording of radar holograms with the RASCAN radars requires minimal training of the operator. Holograms are recorded as individual raster or scanning lines along which the radar head is swept by hand. These lines must be parallel and equidistant to avoid distortion of the image. The time required for the scanning procedure depends on the dimensions of the area, and the selected step between raster lines. Usually for RASCAN-4/4000, the step between lines is equal to 1 cm. Along scanning lines, the step between measurement points equals 0.5 cm. So, typical dimensions of a pixel are 0.5 cm by 1 cm. Obviously, a smaller step between lines increases the scanning time, but a larger step increases pixel size and decreases the quality of images. The optimal choice of pixel dimensions is typically dictated by the inherent radar resolution at shallow depths (based on signal frequency, and antenna design), which has been experimentally confirmed as approximately 2 cm for RASCAN-4/4000 [23].
|
|
|
Fig. 7. Paper sheet with embedded letters that form the word RASCAN. Metal ruler is 12 inches (30.48 cm). |
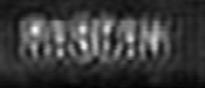
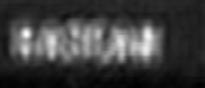
In Fig. 8, eight microwave holograms are represented. From the entire array of all received images, only holograms that were recorded at a frequency of 4 GHz at parallel polarization were chosen for presentation. In the first three images that were recorded through 1, 2, or 3 plaster sheets, the word RASCAN is legible. If the number of sheets is more than three, the outlines of letters become more blurred, and the images display a wavy nature.
These phenomena are readily explained: At very shallow depths, there is direct reflection in nadir from surface of the letters with very high level of reflected signal (higher than the level of the reference signal, and higher than off-nadir reflections).
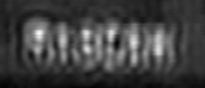
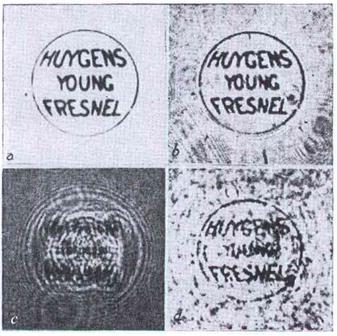
With more sheets over the word, the radar antenna records reflections from letters on inclined angles (off-nadir) at a signal level that is comparable with the reference signal. In this case, the wavy nature of radar images is clearly visible. The RASCAN image recorded through 8 sheets (about 10 cm depth) resembles the optical hologram that was presented by D. Gabor in his classic work [4]. His hologram is presented in Fig. 9 c). These pictures (Figs. 8 and 9) give clear qualitative comparison between two types of holograms: optical and radar ones. Because of absolutely different size-to-wavelength ratio for this type of holograms the number of Fresnel zones that could be visible is also drastically different. This difference could achieve 3-4 orders or more.
|
HSR holograms |
Number of sheets |
|
|
1 |
|
|
2 |
|
|
3 |
|
|
4 |
|
|
5 |
|
|
6 |
|
|
7 |
|
|
8 |
|
Fig. 8. RASCAN holograms recorded through the stack of plaster sheets. Depth is 1.2 cm per sheet. |
|
In this paper, the matter of reconstruction of holograms recorded by subsurface radar is intentionally omitted. The task of radar hologram reconstruction requires special consideration of medium attenuation and wavelength that is comparable with the size of the system and antenna aperture.
|
|
|
Fig. 9. Gabor’s hologram [4]: a) Original micrograph b) Micrograph, directly photographed through the same optical system which is used for the reconstruction d) c) Interference diagram d) Reconstruction of the original; the letters have again become legible. |
There is no direct analogy between the mathematical models of optical and HSR hologram reconstruction. The simplest model for reconstruction of point objects from HSR holograms has been proposed in [28]. For recording and reconstruction of optical holograms, the assumption that the transmission medium is clear and homogeneous is implied and is valid. This is not the case for HSR, making the task of reconstruction very different, and much more difficult (or impossible) for all but the simplest objects (e.g. point targets).
Experiments with RASCAN-4/4000 have demonstrated that the main factors that deteriorate the quality of HSR holograms are related to attenuation and inhomogeneity within the medium in which the electromagnetic wave propagates. Frequently, the level of moisture is the main influence on both of these factors. In contrast to water vapor or humidity, which is transparent in the visible spectrum (fog and rain are not included in consideration), the moisture in soils or construction materials drastically changes their complex permittivity e [3]. Water itself has an anomalously high real part of permittivity e¢ = 81 that depends also on frequency. The main influence of e¢ is on the velocity of an electromagnetic wave in medium that is inversely proportional to Öe¢. The imaginary part of permittivity e¢¢ is proportional to conductivity of the media. Moisture commonly contains dissolved salts in soils and construction materials, and this increases their conductivity and attenuation. This effect depends on the composition of the medium, with concrete and clay representing examples of media that have high levels of conductivity and attenuation in moist conditions.
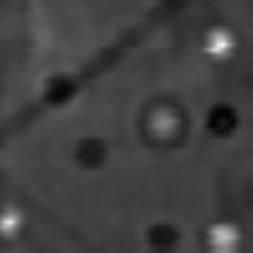
Fig. 10 demonstrates the influence of moisture inhomogeneity on recording holograms and the ability to detect subsurface targets. Holograms in Fig. 10 a) and b) were recorded on the surface of a stack of two foam concrete bricks. In both cases the radar scanned the same area with dimensions of 40 cm by 18 cm. The step of data recording for these experiments is equal to 0.5 cm.
The upper brick has a high level of moisture variation that is visible as the dark versus light contrast pattern in Fig. 10 a). For the next scan, a wire was placed under first brick, Fig. 10 b). The holograms have almost the same appearance, despite the presence of the wire. Because of the moisture variation in the top brick, the wire is almost invisible in this image. The bottom image Fig. 10 c) is a result of the subtraction of two previous pictures a) and b). In this image, with the static moisture variation removed, it is now possible to observe the position of the wire. Unfortunately, this method cannot be used in any real environment for practical applications because it is not possible to scan an area with and without a target whose presence is to be determined by the scanning itself.
To be correct, it is impossible to subtract the holograms because of their non-linear nature. But at high attenuation, the radar records images that more strongly resemble the actual target than the holographic interference pattern. Thus this operation is possible with some reservations.
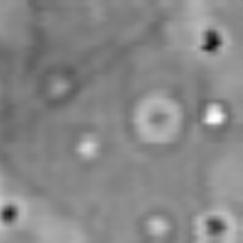
Another problem in the use of HSR is the high attenuation of electromagnetic waves in most media that are commonly encountered in practical applications (wet concrete for example). It is interesting to compare holograms that were recorded for media with high and low levels of attenuation, as in Fig. 11.
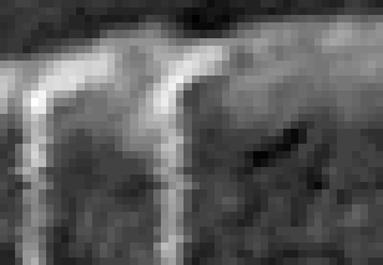
Fig. 11 a) represents a radar hologram of 51mm rocket (Italian-made ARF/8-M3 SNIA) in dry sand [5] which has a relatively low level of attenuation. The waviness of the image is clearly visible, and it is possible to count several concentric diffraction lines in it. An image of a ferroconcrete wall recorded by HSR is given in Fig. 11 b). Concrete has a higher level of electromagnetic wave attenuation in comparison with dry sand [3], so the waviness is not apparent, and the HSR image is reminiscent of an X-ray image.
The influence of attenuation on the quality of holographic radar images has been theoretically investigated in [6]. The main conclusion of that paper is that the number of diffraction lines diminishes with increasing attenuation in the medium. At some level of attenuation, the hologram would have only the first Fresnel zone or just a portion of it.
|
|
a |
|
|
b |
|
|
c |
|
Fig. 10. Influence of moisture inhomogeneity on recording holograms: a) Hologram of two bricks without wire between them b) Hologram of bricks with wire between them c) Result of the subtraction holograms a) and b). |
|


This effect has a simple physical explanation. HSR must receive signal on inclined angles (off-nadir) from the object to form the diffraction lines. Since at inclined angles the path from the transmitter to the object is longer than in nadir, the overall attenuation will be higher, and the object could be invisible. This effect is also strengthened by lower value of antenna gain at angles that are off-axis. If there is enough reflected signal level only in nadir, the image resembles a grey-scale picture as in Fig. 11 b). In this case, the holographic nature of the image is not directly apparent (as it is in Fig. 11 a).
|
|
a |
|
|
b |
|
Fig. 11. Influence of medium attenuation level on character of recording holograms: a) Radar hologram of 50mm rocket in dry sand [5]b) Hologram of a part of ferroconcrete wall [16]. |
|
To demonstrate this effect graphically, a wire has been scanned perpendicularly in different conditions. The level of signal A along a scanning line is presented in Fig. 12 for three cases:
1. The wire is placed in the stack of 8 dry plaster sheets under the fourth sheet; overall thickness of 4 sheets equals 5 cm
2. The wire is placed between two dry foam concrete bricks; brick thickness also equals 5 cm
3. The wire is placed between two wet bricks.
|
|
|
Fig. 12. Influence of attenuation of electromagnetic wave in medium on character of recorded holograms: 1. The wire is under four dry plaster sheets 2. The wire between two dry bricks 3. The wire between two wet bricks.
|
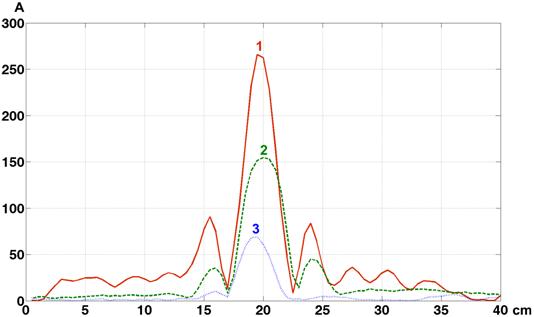
This figure clearly demonstrates the diminution of side lobes as attenuation of electromagnetic wave in the medium increases since the ratio of the main peak height to side lobes for the three cases is approximately 2.9, 3.4, and 6.3 respectively.
V. Applications
The main applications for RASCAN radars are connected with tasks in which sounding to great depths is not required – i.e. sounding of shallow layers is sufficient and/or direct mechanical contact with the surface cannot be assumed. The latter consideration is a disadvantage of ultrasonic inspection systems that represent an alternative non-destructive testing method. In this case, there is commonly no special requirement to measure the depth to an object. Estimation of object depth in the medium may be desirable, but not as critical as detection and classification of the object from its recorded microwave image. As examples, it is possible to refer to the tasks of mine detection for humanitarian demining and detection of clandestine listening devices or “bugs” in buildings. In these cases, the main goal is detection of a concealed object, and knowing its depth is not so important. Imaging of the buried object shape is one of the main advantages of the holographic method. In any case, the detected object has to be eliminated. For mine clearance, if necessary, mine depth can be estimated with a sapper spike. Difficulties with depth estimation for RASCAN radars are connected with the fact that restoration of holograms (by the algorithms offered in [28]) is possible only for environments with low attenuation of electromagnetic waves. In the majority of practically important cases, sounded media have high attenuation and the wave nature in registered images is not visible.
A. Surveying of Building Structures for Determining the Position of Defects, Reinforcement, Voids and other Heterogeneities
To demonstrate the capabilities of holographic radar technology, survey work in one of Saint-Petersburg’s historical buildings is described. The former Senate building was being renovated for use by the Constitutional Court of the Russian Federation. The building was designed by the outstanding architect K.I. Rossi in 1829-1834 and has great value for Russian culture. According to the restoration project a heat floor system was installed in the building, with the heating pipes being under concrete covering. As-built drawings were sufficiently ambiguous that the pipes were in danger of accidental damage by nails when laying a parquet floor.
The following installation technology of sub-floor heating system is usually used. First, the metal mesh is laid on the sub-floor. The size of the mesh cells is typically 15 cm ´ 15 cm square. Then, the pipes are fastened to the mesh by plastic clips. Various types of pipes are used, including cross-linked polyethylene (PEX), multi-layer (a composite of PEX, aluminum and PEX) and polybutylene (PB): copper pipes are not used now. The spacing of the pipes is around 30 cm. The pipes are then covered by a finishing layer of cement. The depth of the concrete above the pipes is typically about 3 cm.
There was concern that the plastic pipes of the heater system would be invisible against the background of the metal mesh because plastic has lower permittivity contrast with the cement than does the metal mesh. It has been mentioned that the object contrast on holographic radar images depends on reflectivity of the object as well as phase shift, which is a function of the distance to the object. For extended or elongate objects, the orientation of the received signal polarization also has great influence on the resulting image contrast. At improper polarization, a long metal bar or wire can be invisible.
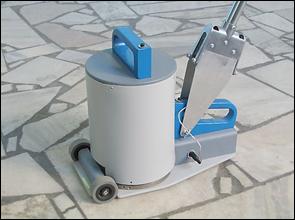
The work of floor inspection was carried out with the aid of a RASCAN-4/2000 holographic subsurface radar, see Fig. 13. The total area of scanned surface was 16.7 sq. m. The overall time of work (disregarding the time for equipment deployment) was about 5 hours. More than half of that time was spent on scanning while the rest was spent on plotting the layout of pipes and cables directly on the floor. While inspecting the floor, a tangle of power and communication cables was found. This added to the complexity while interpreting the radar images.
|
|
|
Fig. 13. RASCAN-4/2000 radar head. |
The surveyed area was divided into sections of 1.7 by 2.0 m. After recording a radar image of each section, the operator analyzed the image and drew the results on the floor with chalk. The position of heater tubes was marked by blue chalk, with red chalk used for cables and wires, see Fig. 14. As was assumed before investigation, there was no difference between pipes and metal mesh in the radar images at parallel polarization. In the radar images at cross polarization, the plastic pipes were clearly visible. An interesting part of a radar image is shown on Fig. 15. In this fragment, one can clearly see how the heater pipes are bending over the cable.
|
|
|
|
Fig. 14. Position of heater tubes was marked by blue chalk, and red chalk was used for cables. |
|
|
|
|
|
Fig. 15. Part of radar image recorded under surface floor. |
|
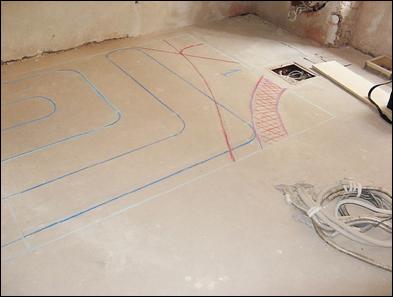
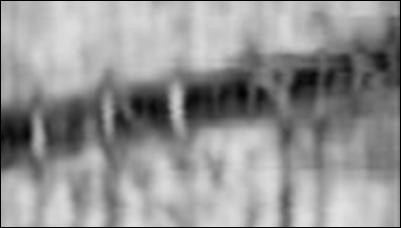
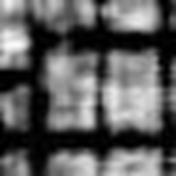
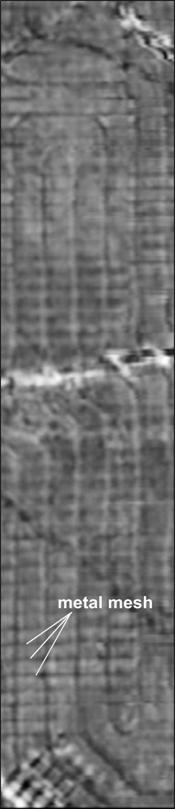
Fig. 16 presents three images: a) raw cross polarization radar image at the frequency of 2.0 GHz; b) image "a" after numerical filtration; c) plan of water tubes (black lines) and communications (hatched areas). The observable horizontal lines in image "a" are reflections from the metal mesh in the cross polarization radar channel. The elements of the grid in another direction can be clearly seen only in the parallel polarization channel (this image is not presented here). The overall dimensions of the radar image in Fig. 16 are 1.70 m by 8.04 m. An FFT-based numerical algorithm was proposed to suppress reflections from the periodic structure of metal mesh in the radar images [24]. Fig. 16 b) demonstrates the effectiveness of this algorithm.
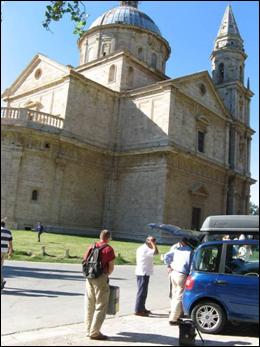
One more example of using the Rascan holographic radar technology was an inspection of a church in Toscana, Italy. The Church of S. Biagio was built near the city of Siena by Antonio da Sangallo the Younger more than 500 years ago, Fig. 17. The international team of Italian, American, and Russian scientists conducted inspection of the floor in the Church of S. Biagio in September of 2007.
|
|
|
|
|
a) |
b) |
c) |
|
Fig. 16. Interpretation of the radar image: a) raw
radar image at the frequency of 2.0GHz (cross polarization); b) image
"a" after Fourier-based numerical filtration; |
||
|
|
|
Fig. 17. The Church of S. Biagio. |
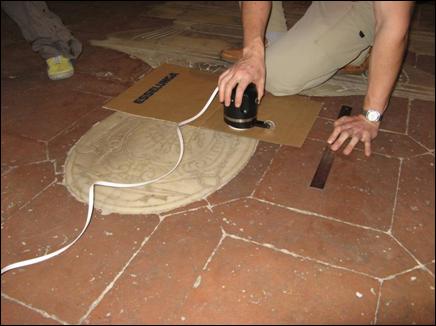
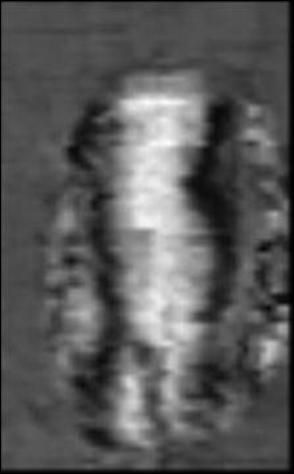
One of the inspected areas of floor was a marble inlaid medallion as pictured in Fig. 18. The marble decoration dates to about of 1590 Ad, and according to documentary sources, it was laid during the burial ceremony of a church man (Prelatio in Latin) belonging to the family Cervini. During the project in the Church of S. Biagio, the subsurface holographic radar RASCAN-4/4000 was used. This radar is small and is operated by hand scanning, Fig. 18.
|
|
|
Fig. 18. Inspection of a marble medallion in the
church by |
The radar image of the marble medallion in Fig. 19 reveals a complex subsurface structure, the origin of which is not clear without additional information. To interpret the obtained images, a series of additional experiments involving marble plates, wooden bars, and bricks was conducted as well as historical investigation. Combining results of the auxiliary experiments and historical research, it was found that under the marble stone there is probably an empty area with wood or brick elements to support the medallion. Thus, the cavity under the medallion is probably no other than Vincenzo Cervini’s burial chamber.
|
|
|
Fig. 19. Radar image of the medallion at the frequency of 3.9 GHz. |
B. Non-Destructive Testing of Dielectric Construction Details
The disastrous loss of the US Space Shuttle Columbia forced researchers to find new possible methods and devices for non-destructive testing and evaluation of the space shuttle thermal protection system, as well as the external fuel tank insulation foam. Such methods of diagnostics could be useful not only for current space vehicles but also for perspective spacecrafts such as manned space vehicle Orion.
The main problem in non-destructive testing of heat protection systems for space vehicles is that the task requires surveying the layer of a dielectric material that lies directly on the metal load-bearing shell. If similar composite designs were sounded using the impulse subsurface radar, reverberations of a radiated impulse between the metal surface and radar antenna would considerably complicate detection of heterogeneities and defects in dielectric heat protection material [19]. Holographic subsurface radars are free from this drawback since the signal reflected from the metal surface parallel to the surface of heat-shielding material has constant phase and does not influence the quality of recorded radar images.
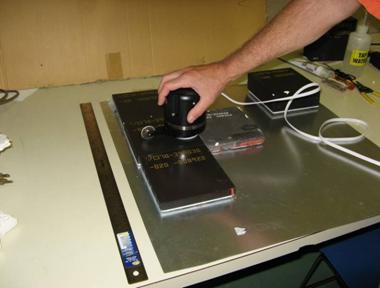
Pilot experiments have been conducted to investigate various types of anomalies within a rigid 5 centimeters thick foam plastic layer placed over an aluminum sheet. The anomalies presented by voids in the foam, some of which were water-filled, were easily detected by a RASCAN-4/4000 radar [14]. Further experiments with the same type of radar were conducted on real Space Shuttle heat protection tiles on an aluminum sheet similar to the aluminum body of the shuttle with the help of NASA Jet Propulsion Laboratory, CA, Fig. 20.
In Fig. 21, the results of tile inspection are presented [15]. Areas on the surface of the aluminum sheet, in which the glue under the tile was absent, are seen as white spots. The reverberation effect, intrinsic in this situation to the impulse radar, is absent in the images. Further research to define capabilities of such diagnostics, and to determine a proper frequency range for such radar is necessary in the future.
|
|
|
Fig. 20. Different types of Space Shuttle tiles that were used in experiments. |
|
|
|
Fig. 21. A result of tile inspection by Rascan-4/4000 radar. |
C. Detection of Water Infiltration in Underground Parts of Building
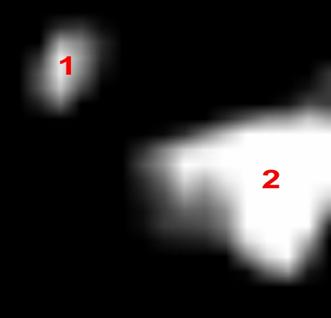
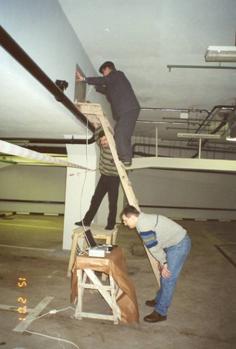
Because of the high dielectric permittivity of water, areas with increased level of moisture must have high contrast on microwave images. This assumption was confirmed in experiments with RASCAN radars. Such an experiment took place in an underground garage with the purpose of finding places of ground water intrusion, Fig. 22. As a result of radar inspection of a garage ceiling bench, the microwave image presented in Fig. 23 was recorded. Two inclined, bright, elongated spots in the upper part of the image were interpreted as voids through which water advanced vertically down. To test the assumption a hole was drilled at one of the spots through which water immediately revealed itself. Builders concluded that the cracks had to be sealed to prevent further moisture intrusion.
|
|
|
|
Fig. 22. Surveying of a ceiling bench in an underground garage. |
Fig. 23. Microwave image of area 30 ´ 50 cm. The bright spots in the image are traces of water intrusion. |
D. Security Applications
One of possible applications for holographic radars is detection of listening or bugging devices intended for clandestine recording of confidential information in government, business, or residential buildings. Due to high resolution of RASCAN radars, it is possible not only to find suspicious areas in different parts of a building but also identify the type of a bugging device on recorded microwave images.
Although resolution of RASCAN radars is worst than of X-ray devices, their essential advantage is the ability to record images with one-side access to the surveyed object. In many cases, the required two-side access makes impossible application of X-ray imaging. Moreover, RASCAN radars emit less than 10 mW of power, and are absolutely safe for the operator and nearby personnel. This is not the case when operating X-ray devices, which require strong safety precautions to prevent human health hazards. The RASCAN radar could also be an effective tool to complement non-linear junction detectors in searches for bugging devices. Use of a RASCAN radar on suspicious places found by non-linear junction detector could significantly lower the level of false alarms produced by the latter when it is operated solo.
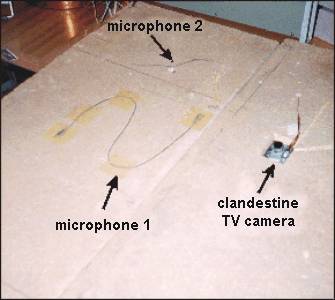
Fig. 24 shows a wall model made of chipboard plates with built-in bugging devices: two microphones and a tiny TV camera. From above, the model has been covered by two other layers of chipboard, with total thickness of 5 cm. The result of scanning this model by Rascan-4/4000 radar is pictured in Fig. 25. The recorded microwave image precisely represents the form of the hidden objects beneath the chipboard plates. This allows discrimination of bugging devices from innocuous objects that may be present naturally in building designs (nails, reinforcements, etc.)
To improve radar resolution, a new model, Rascan-4/7000, was developed. This radar operates in the frequency range of 6.4-6.8 GHz. Experiments conducted with the device have shown that its sensitivity is enough to detect fiber-optic cables even without any metal content.
E. Humanitarian Demining
Unexploded ordnance (UXO) remediation is the number one environmental concern on millions of square kilometers of war zones and formerly-used defense sites all over the world. While subsurface radar is not a perfect tool for detecting and mapping UXO over large areas, many experts have proposed that radar could be used for small area studies, or for interrogation of anomalies identified by other geophysical methods (e.g. magnetometry or electromagnetic induction) to discriminate UXO from clutter, or even identify UXO types prior to excavation [25]. While considerable progress has been made in developing equipment and algorithms for discriminating UXO using conventional impulse radars, a basic limitation of impulse radar is that signal spreading causes all targets to appear in subsurface images as non-unique sets of parabolic reflections that do not generally resemble the actual target [26]. Research on recording of microwave images of mines in the ground began at the end of 1980’s with the use of the standard continuous-wave MMP mine detector, which operated at a frequency of 600 MHz [27].
|
|
|
|
Fig. 24. Multilayer chipboard model with overhearing devices that are placed between the layers. |
Fig. 25. Result of overhearing devices surveying. |
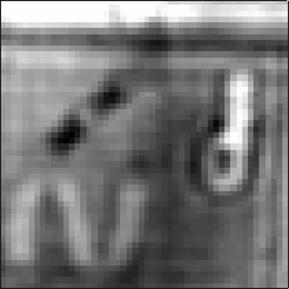
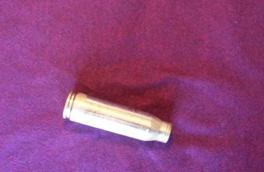
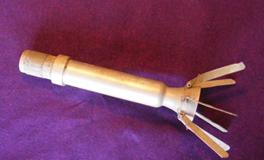
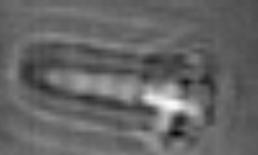
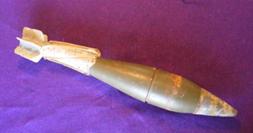
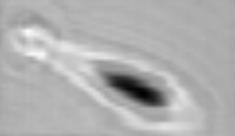
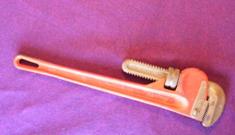
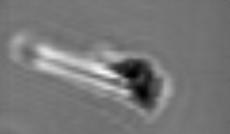
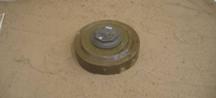
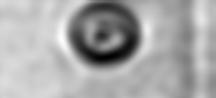
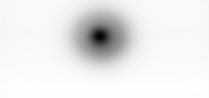
In order to test the suitability of holographic radar of Rascan type for discriminating UXO, several inert UXO items, ranging in diameter from 40 to 81 mm, were buried in a sand test bed, and scanned with a Rascan-4/4000. All items were buried horizontally, just under the surface. For these large, complex objects, the depth to the upper surface ranged from near zero to about 8 cm. For example, the fins on the rocket were nearly exposed, but the cylindrical body part lay at about 7 cm. The wrench was a nearly uniform 3 cm, with the adjustment collar nearly exposed. The thickest part of the body of the 80mm shell was at the surface, with the fins at about 4 cm, and the thinnest part of the body at 7 or 8 cm. The 40mm shell was just barely covered by sand.
The Rascan holographic image of each buried item is shown next to a photograph of the item in Fig. 26. Note that the figures clearly illustrate the wave nature of Rascan images. However, all of the images strongly resemble the actual item - even without reconstruction of the hologram from the recorded interference pattern. This preliminary study emphatically supports the opinion that the radar - in particular the holographic radar - could be used to interrogate/identify potential buried UXO items.
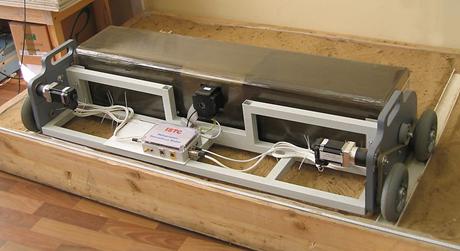
A more advanced prototype of a holographic radar that performs electromechanical scanning of ground surface, and equipped with an additional induction channel was created under the International Science and Technology Center (ISTC) Project #2541 in 2007. This radar is presented in Fig. 18. Technical specifications of the holographic radar channel of the prototype are close to that of the Rascan-4/2000 radar.
Scanning of a line in this radar is performed by automatically sweeping the radar head across the device chassis, perpendicular to the travel direction of the entire system. The metal detector coil is placed on the radar antenna’s lower face. This allows registration of the same area both in the radar and metal detector channels simultaneously. The images of various objects recorded by the radar, developed under ISTC project # 2541, are presented in Fig. 28. The objects were buried in sand at a depth of 5 cm. The left column has photos of the objects, the middle column shows radar images and the right column presents images recorded in the metal detector channel.
The metal detector channel reveals an anti-tank mine in metal case. In this channel, the image of an entirely plastic mine is absent (all metal details including the detonator, were removed). A thin wire of 25-micron diameter is also not visible for the metal detector due to its disconnected form, and its small metal content. If the same wire were looped, it would give a powerful signal in the metal detector channel. However, the contrast of wires in radar images depends on channel polarization, and does not depend on the diameter and form of a wire.
The main obstacle that complicates the use of subsurface radars, irrespective of their type, in humanitarian demining operations is the presence of different heterogeneities on the ground surface or at shallow depths. Reflections of electromagnetic waves from such heterogeneities and other objects of anthropogenic origin create a cluttered background difficult for detection and identification of mines. In this sense, the task of sounding building construction details or bugs by holographic radars is much easier. Here, most cases involve surveying over a smooth surface and a priori assumptions about concealed objects are frequently present.
|
Object photo |
Microwave hologram of buried object |
|
|
|
|
40mm shell casing |
|
|
|
|
|
50mm rocket |
|
|
|
|
|
80mm shell |
|
|
|
|
|
Pipe wrench |
|
|
Fig. 26. Microwave hologram images recorded by Rascan-4/4000 subsurface radar |
|
|
|
|
Fig. 27. Holographic radar with electro-mechanical scanner. ISTC project #2541. |
|
Object photo |
Microwave image of the object |
Metal detector channel under |
|
|
|
|
|
Buried metal wire of 0.25μm diameter placed at an angle to the direction of radar motion |
||
|
|
|
|
|
Russian metal-body TM-62M antitank mine buried in sand |
||
|
|
|
|
|
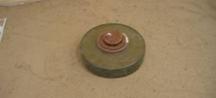
Russian plastic-body TM-62PZ antitank mine buried in sand |
||
|
Fig. 28. Images recorded by subsurface radar and metal detector. |
||


VI. Conclusion
In this work a summary of the theory, technology and applications of the holographic subsurface radar is presented. The main advantages and limitations compared to the commonly used impulse radars are also reported. In general, it is worth mentioning that the subsurface radar is not a universal method of opaque media sounding. In many practically important cases, the penetration depth is not sufficient, and the quality of recorded images does not allow reliable identification of detected objects. However, appropriate choice of the type of probing signal and its frequency range can lead to useful results that may be impossible to achieve with other non-destructive diagnostic methods. The typical field of application for holographic subsurface radar is the sounding of opaque media at shallow depths where high plan-view resolution is desired. In these cases, it is possible to define the shape and dimensions of targets and clutter objects with sufficient accuracy, and to formulate reasonable assumptions concerning their nature to develop image-based classifiers.
Acknowledgement
This work was supported by the by the President of Russian Federation Grant MK-694.2009.9, Russian Foundation for Basic Research, and Program of RF Ministry for Educational and Science.
References
[1] M. I. Finkelstein, “Subsurface radar”, Telecomm. Radio Eng. Part 2, vol. 32, 1977, pp 18-26 (English translation).
[2] M.I. Finkelstein, V.A. Kutev, and V.P. Zolotarev, Applications of subsurface radar in geology, Nedra, Moscow, 1986 (in Russian).
[3] D. J. Daniels, Surface-penetrating radar. Pub. by IEE. London, 1996.
[4] D. Gabor, “A new microscopic principle,” Nature, 161, 1948, pp. 777-778, http://www.nature.com/physics/looking-back/gabor/index.html#f2.
[5] S. Ivashov, V. Razevig, I. Vasilyev, A. Zhuravlev, T. Bechtel, and L. Capineri, “The holographic principle in subsurface radar technology”, International Symposium to Commemorate the 60th Anniversary of the Invention of Holography, Springfield, Massachusetts, USA, October 27-29, 2008, pp. 183-197, Available: http://www.rslab.ru/downloads/ivashov_sem_2008.pdf .
[6] N. P. Chubinsky, “Possibilities of holographic methods at sounding of lossy media”, Proceedings of 4th Russian conference Radio-Physics Methods in Remote Sensing, Murom, 30 June – 3 July 2009, pp. 47-60, (in Russian). Available: http://www.mivlgu.ru/conf/murom2009/img/doclad/lecture/3.pdf .
[7] E.N. Leith, and J. Upatnieks, “Reconstructed wave fronts and communication theory”, J. Opt. Soc. America, 52, No. 4. XIV Advertisement, 1962, Available: http://www.opticsinfobase.org/viewmedia.cfm?uri=josa-52-10-1123&seq=0 .
[8] D. L. McMakin, D .M. Sheen, J. W. Griffin, and W. M. Lechelt. “Extremely high-frequency holographic radar imaging of personnel and mail,” Sensors, and Command, Control, Communications, and Intelligence (C31) Technologies for Homeland Security and Homeland Defense V, edited by Edward M. Carapezza, Proc. of SPIE Vol. 6201, 62011W, 2006.
[9] G. Junkin; and A. P. Anderson, “Limitations in microwave holographic synthetic aperture imaging over a lossy half-space,” Communications, Radar and Signal Processing, IEE Proceedings F, Volume 135, Issue 4, August 1988, pp. 321 – 329.
[10] S. I. Ivashov, V. V. Razevig, A. P. Sheyko, and I. A. Vasilyev, “A review of the remote sensing laboratory's techniques for humanitarian demining”, Proceedings of International Conference on Requirements and Technologies for the Detection, Removal and Neutralization of Landmines and UXO, EUDEM2-SCOT-2003, 15-18 September 2003, Vrije Universiteit Brussel, Brussels, Belguim, 2003, Vol. 1, pp 3-8. Available: http://www.rslab.ru/downloads/paper_id106.pdf
[11] L. Capineri, S. Ivashov, M. Inagaki, C. Windsor, T. Bechtel, “Holographic subsurface radar intended for searching of mines in the soil”, Final report on the NATO collaborative linkage grant CBNPR.N. RCLG9 82520, 2009.
[12] S. I. Ivashov, V. I. Makarenkov, V. V. Razevig, V. N. Sablin, A. P. Sheyko, I. A. Vasiliev, “Concrete floor inspection with help of subsurface radar,” Eight International Conference on Ground-Penetrating Radar, GPR'2000, May 23-26, 2000, University of Queensland, Gold Coast, Queensland, Australia, pp. 552-555. Available: http://www.rslab.ru/downloads/floor_gpr_2000.pdf
[13] L. Capineri, P. Falorni, G. Borgioli, A. Bulletti, S. Valentini, S. Ivashov, A. Zhuravlev, V. Razevig, I. Vasiliev, M. Paradiso, M. Inagaki, C. Windsor, T. Bechtel, “Application of the RASCAN holographic radar to cultural heritage inspections,” Archaeological Prospection, 16, pp. 218-230, 2009. Available: http://www3.interscience.wiley.com/cgi-bin/fulltext/122520547/PDFSTART
[14] S. I. Ivashov, I. A. Vasiliev, T. D. Bechtel, C. Snapp, “Comparison between impulse and holographic subsurface radar for NDT of space vehicle structural materials,” Progress in Electromagnetics Research Symposium 2007, Beijing, China, March 26-30, 2007, pp. 1816-1819. Available: http://www.rslab.ru/downloads/piers07.pdf
[15] T. Lu, C. Snapp, T.-H. Chao, A. Thakoor, T. Bechtel, S. Ivashov, I. Vasiliev, “Evaluation of holographic subsurface radar for NDE of space shuttle thermal protection tiles,” Sensors and Systems for Space Applications. Proceedings of SPIE, Volume 6555, 2007. Available: http://www.rslab.ru/downloads/psi65550s.pdf
[16] I. A. Vasiliev, S. I. Ivashov, V. I. Makarenkov, V. N. Sablin, and A. P.Sheyko , “RF band high resolution sounding of building structures and works”, IEEE Aerospace & Electronic Systems Magazine, Vol. 14, No. 5, May 1999, pp. 25-28. Available: http://www.rslab.ru/downloads/00765776.pdf
[17] “Ultra-Wideband Transmission Systems”, ET Docket No. 98-153, First Report and Order, FCC 02-48 (released April 22, 2002).
[18] J. Dennis, “GPR – The Impact of New FCC Regulations”, GSSI, July 25, 2002.
[19] V. V. Chapursky, S. I. Ivashov, V. V. Razevig, A. P. Sheyko, I. A. Vasilyev, V. V. Pomozov, N. P. Semeikin, D. J. Desmond, Subsurface Radar Examination of an Airstrip, Proceedings of the 2002 IEEE Conference on Ultra Wideband Systems and Technologies, UWBST’2002, May 20-23, 2002, Baltimore, Maryland USA, pp. 181-186. Available: http://www.rslab.ru/downloads/chap_b.pdf
[20] http://www.rslab.ru/downloads/scan.avi
[21] http://www.rslab.ru/downloads/ptm3.avi
[22] http://www.rslab.ru/?lang=english&dir=product&item=rascan4&point=result&entry=animation
[23]
E. Bechtel, S. Ivashov, T. Bechtel,
E. Arsenyeva, A. Zhuravlev, I. Vasiliev, V. Razevig, and
A. Sheyko, “Experimental determination
of the resolution of the Rascan-4/4000
holographic radar system,” 12th International Conference on Ground Penetrating Radar,
June 16-19, 2008, Birmingham, UK.
http://www.rslab.ru/downloads/bechtel_et_al.pdf
[24] V. V. Razevig, S. I. Ivashov, A. P. Sheyko, I. A. Vasilyev, and A. V. Zhuravlev “An Example of Holographic Radar Using at Restoration Works of Historical Building”, Progress In Electromagnetics Research Letters, Vol. 1, 2008, pp. 173–179.
[25] D. K Butler, “Potential fields methods for location of unexploded ordnance”, The Leading Edge; August 2001, vol. 20, no. 8, pp. 890-895.
[26] M. B. Higgins, C.-C. Chen, and K. O'Neill, “Improvement of UXO Classification Based on Fully-Polarimetric GPR Data”, USA UXO/Countermine Forum, New Orleans, April, 2001
[27] S. I. Ivashov, V. N. Sablin, and I.A. Vasilyev, “Wide-Span Systems of Mine Detection”, IEEE Aerospace & Electronic Systems Magazine, May 1999, Vol. 14, No. 5, pp. 6-8.
[28] V.V. Chapursky, S.I. Ivashov, V.V. Razevig, A.P. Sheyko, I.A. Vasilyev, Microwave Hologram Reconstruction for the RASCAN Type Subsurface Radar, Proceedings of the Ninth International Conference on Ground Penetrating Radar, GPR’2002, April 29 - May 2 2002, Santa Barbara, California USA, pp. 520-526.
* Low emitting power guarantees full safety for personnel while using RASCAN radars, Russian sanitary certificate # 77.01.09.650.П.041358.10.05, October 19, 2005.