Analysis of the Atmosphere Interaction with the Ocean Surface by Means of Satellite Microwave Radiometry in the Resonance Bands
A. G. Grankov, A. A. Milshin
Kotel’nikov Institute of Radio-engineering and Electronics of RAS, Fryazino Branch
The paper is received on February 10, 2014
Abstract. A comparison of the ship-borne data obtained in the NEWFOUEX-88 and ATLANTEX-90 experiments from aboard the R/Vs Victor Bugaev, Musson, and Volna in the Newfoundland energy-active zone in the North Atlantic and the data of the simultaneous measurements of brightness temperature of the microwave natural radiation of the ocean and atmosphere obtained with a SSM/I scanning radiometer from the US F-08 DMSP meteorological satellite is presented. The brightness temperature was found been clearly correlated with the synoptic variations of the heat fluxes at the interface between the ocean and atmosphere, and the enthalpy of the atmospheric boundary layer. The paper analyses the role of regions of the radiowave`s resonant absorption in the atmospheric molecular oxygen and water vapour, which are responsible for the formation of connection between synoptic variations of the natural microwave radiation and surface heat fluxes.
Keywords: satellite microwave radiometry, system ²ocean-atmosphere², brightness temperature, surface heat fluxes, atmospheric enthalpy.
1. Introduction
Modern diagnostics of large-scale ocean–atmosphere thermal interaction from microwave satellite radiometry data is built upon the idea of using the semiempirical global aerodynamic approach, which links the radiation and thermal properties [1–3]. This approach rests on the fact that the basic parameters involved in the bulk formulas (the ocean surface temperature, the temperature and humidity of air, and the wind velocity in near-water atmospheric layers) are responsible (directly or indirectly) for the generation and transformation of the natural microwave radiation from the system “ocean–atmosphere” (SOA).
In this work, we discuss the efficiency of using the natural microwave radiation intensity of the SOA as a direct characteristic of heat-and-moisture exchange between the ocean and atmosphere on the synoptic (weekly) scale, where the intensity of ocean–atmosphere interaction in middle latitudes of the Earth is maximum. Our analysis employs oceanographic, meteorological, and aerologic observations made aboard the Victor Bugaev, Musson, and Volna research vessels (State Institute of Oceanography; April, 1990) in the Newfoundland energy-active zone of the North Atlantic region during the NEUFOUEX-88 and ATLANTEX- 90 experiments. Based on these data, we calculate the brightness temperature of SOA microwave radiation in the cm- and mm-wave ranges (by simulating satellite, aircraft, and ship measurements). Also, we consider its dependence on the synoptic variation of vertical turbulent fluxes of sensible and latent heat at the ocean–atmosphere interface. Finally, we compare the heat fluxes recorded in the ship experiments with the microwave radiometry data obtained simultaneously with an SSM/I radiometer aboard the US F-08 satellite.
This radiometer was the only instrument for sounding the ocean during the NEUFOUEX-88 and ATLANTEX- 90 experiments. The combination of the measurements aboard the Victor Bugaev, Musson, and Volna vessels with the data of the satellite-borne SSM/I radiometer allowed us to account for the intimate linkage between the SOA brightness temperature and processes at the ocean–atmosphere interface.
2. Approach to the problem solution
From the entire array of data gained afloat, we used only those obtained during the stationary phases of the experiments (March, 1988 and April, 1990). Unlike other phases, these two (i) feature regular oceanographic, meteorological, and aerologic observations and (ii) are expected to give the most reliable results on the time evolution of the ocean and atmosphere parameters, since the vessels were anchored within definite areas.
Over that time interval, the vessels made measurements in the Gulf Stream delta and in the eastern branch of the Labrador Current, where the synoptic variability of the ocean and atmosphere parameters is very high [4, 5]. To calculate the radiation properties of the SOA, we use the plane-layer model of radiation. In terms of this model, for observations in the nadir direction from an altitude H, the brightness temperature (BT) of the SOA microwave radiation consists of three components:
where
![]() =
= ![]()
![]() ,
,
is the BT of the atmosphere-attenuated up-going radiation from the ocean surface (the quantity is proportional to the emissivity of the water surface and to its thermodynamic temperature Ts);
![]()

is the BT of the atmosphere up-going radiation;

![]()
is the BT of the atmosphere down-going radiation reflected by the water surface; T(z) is the thermodynamic temperature of the atmosphere at a level z;

is the integral absorption of the radiation by the atmosphere, which depends on the absorption per unit length gS and the thickness z of the absorbing layer measured from the ocean surface (z = 0); and R is the coefficient of reflection of the atmosphere down-going radiation from the water surface.
With this model, we analyzed the daily and synoptic variations of the SOA’s BT in the wavelength range 0.5–5.0 cm at the stationary phases of the ATLANTEX-90 experiment aboard the Victor Bugaev, Musson, and Volna research vessels (R/Vs). From the filed data gathered at the stationary phases, we extracted the following:
(i) hourly values of the ocean surface temperature Ts and wind velocity V at the water surface to calculate the BT of the ocean surface; (ii) the total (integral) moisture content in the troposphere to evaluate the water-vapor-related integral absorption of the underlying surface both with and without cloudiness (the measurements were made aboard the Volna vessel at 15–20 min intervals with a set of microwave radiometers (Voeoekov Main Geophysical Observatory, MGO) at wavelengths of 0.8 and 1.35 cm; (iii) the temperatures Ta, relative humidity q (water vapor pressures e), and pressures P of air (measured at 20 levels between 10 and 16 000 m every six hours) to estimate not only the total absorption τ but also the absorption per unit length gS in the troposphere, from which refined estimates of the atmosphere’s transfer function and, hence, the luminance temperature can be found; and (iv) the estimates of turbulent heat, qh, and moisture, qe, fluxes at the ocean–atmosphere interface, which were calculated in the State Institute of Oceanography by using MGO parameterizations [6] based on hourly observational data for Ts, Ta, V, and e.
The contributions from different layers to the radiation properties of the SOA and their effect on the interplay between the radiation properties and thermal fluxes at the interface on the synoptic scale were evaluated with radiation detectors arranged at different altitudes. In the first case, the detectors (microwave radiometers designed for the cm- and mm-wave ranges) with downward-directed antennas were placed in free air to simulate satellite observations. In the second case, the detectors with downward-directed antennas were placed at the boundary between free air and the atmospheric boundary layer (a turbulent layer of thickness from 0 to 1000 m), which simulates measurements aboard an aircraft at altitudes of 1000 ÷ 1500 m above sea level. In the third case, the detectors with downward-directed antennas were 10 ÷ 20 m above the ocean–atmosphere interface to simulate observations afloat.
3. Computation of the brightness temperature and comparison with heat fluxes
The response of the SOA’s microwave radiation field to the variability of heat fluxes at the ocean–atmosphere interface was the most distinct in April 8–13, 1990. Over this period, the variation of the (sensible +latent) heat fluxes were about 800 W m-2 for the Victor Bugaev vessel, 500 Wm-2 for the Musson vessel, and about 400 W m-2or the Volna vessel [4, 5].
Among the spectral ranges used to calculate the SOA’s BT (5.4, 5.6, 5.9, 0.8, 1.0, 1.35, 1.6, 3.2, and 5.0 cm), the BT contrast over this time interval was found to be the greatest in the wavelength range 0.59 ÷ 1.60 cm, which corresponds to the resonant radiation from (absorption by) atmospheric oxygen and water vapor (Fig. 1).
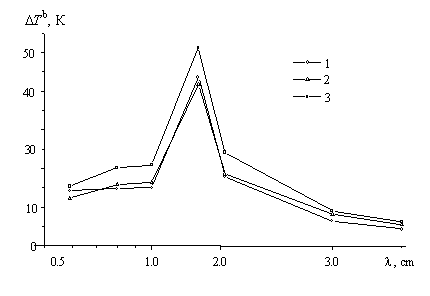
Fig. 1. Spectral dependence of the SOA brightness temperature contrast DTb in the wavelength range 5 mm - 5 cm during the passage of a cyclone (April 8-13) through the places of location of the RV/s V.Bugaev (1), Musson (2), and Volna (3)
One can observe in this piece of electromagnetic spectrum a close correlation between estimates of variations of the SOA brightness temperature Tb and near-surface heat fluxes qhe at the satellite, aircraft, and vessel levels of simulated results of outer observations.
This idea is illustrated by Figs 2a,b,c, which compare the values of the qhe, and Tb0.59 (the BT at a wavelength of 5.9 mm), and Tb1.35 (the BT values at a wavelength of 1.35 cm) obtained aboard the R/Vs V. Bugaev, Musson, and Volna.
It is seen that, in response to the increase in the fluxes qhe, the SOA microwave radiation diminishes its brightness temperature Tb and vice versa: as the value of qhe decreases, Tb grows. Over this period, the brightness temperature variations are, on average, 15−20 K at the wavelength 5.9 mm and 30−40 K at the wavelength 1.35 cm.
|
|
|

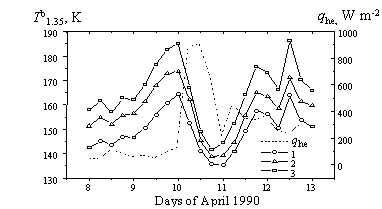
Fig. 2a. Comparison of the total heat flux qhe with the simulated SOA brightness temperature estimates Tb0.59 and Tb1.35 in the places of location of the R/V V. Bugaev during the period 8-13 April of 1990 (experiment ATLANTEX-90). Simulation of satellite (1), aircraft (2), and vessel (3) observations
|
|
|
|

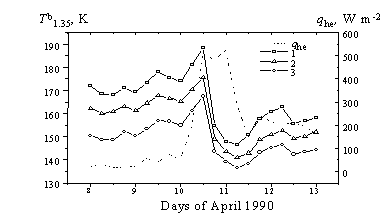
Fig. 2b. The same as in the Fig. 2, but for the vessel Musson
|
|
|
|
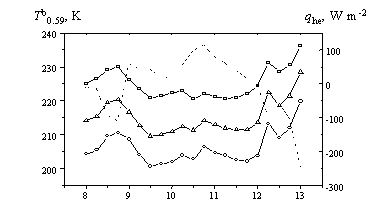
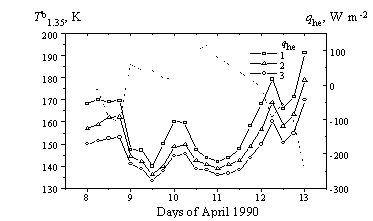
Fig. 2c. The same as in the Fig. 2a and 2b, but for the vessel Volna
The Duamel`s integral equation let us to calculate the function r(t) of the brightness temperature Tb response (sensitivity) to the total heat flux qhe variations:

We analyzed with this equation more rigorously the phenomena of a time delay of the SOA brightness temperature response in the resonant spectral domains 0.59 cm and 1.35 cm compared the variations of surface heat fluxes resting upon the results adjusted above (see Fig. 3).
|
|
|
|
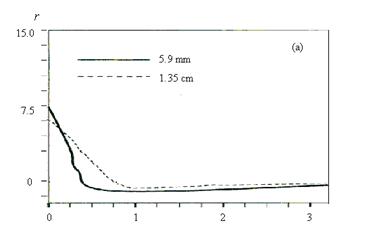
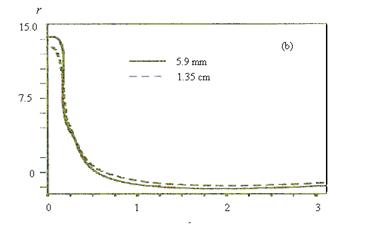
Fig. 3. Sensitivity r of the SOA brightness temperature at the wavelengths 0.59 and 1.35 cm to heat flux variations (in K W m-2)-days in the areas observed by the R/Vs V. Bugaev (a),and Volna (b). Aalong the horizontal axe - days
One can consider the equation (2) as a modification of the classic Volterra`s equations of the first kind inherent to the class of equations of the convolution type. We used proposed some iterative procedure determining the function r(t) as a linear superposition of the exponential functions:

where coefficients ai и bi are calculated from the condition of minimal discrepancy between the SOA brightness temperature values and their approximations, characterized by values of the root-mean square (rms) error.
The calculations show that the value N = 6 in the formula (2) is acceptable for this task; a mean value of the rms error in this case does not exceed 5 ÷ 7%.
The result shown in the Fig. 2c for the vessel Volna is especially useful for us due to a fuzziness of variations of the parameters Tb and qhe (see Fig. 2.6c). This case is distinguished from the cases illustrated in the Figs. 2a and 2b where the fact of the time shift between these parameters is noticeable obvious without any mathematical analysis.
|
|
|
|
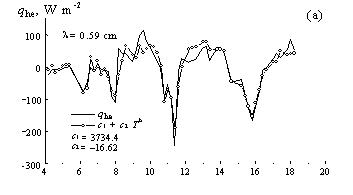
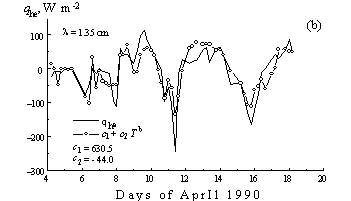
Fig. 4. Six-hour samples of the total heat fluxes qhe, as the linear combinations of the SOA brightness temperatures at the wavelengths 0.59 cm and 1.35 cm computed from the meteorological and aerologic data obtained during the stationary phase of the experiment ATLANTEX-90 (R/V Volna)
We studied regression relationships in the form of linear correlations between six-hour samples (Fig. 4) of the total heat flux qhe at the ocean–atmosphere interface and the brightness temperature of the SOA microwave radiation (the simulation of satellite measurements) at wavelengths of (a) 5.9 mm and (b) 1.35 cm (the temperature was calculated from the oceanographic and aerologic measurements aboard the Volna) and the model estimates of the SOA brightness temperature. It is seen that there is an intimate relation between the synoptic variations of the heat fluxes (recorded by the Volna) and the model estimates of the SOA brightness temperature. For the six-hour samples of the parameters qhe and Tb in the resonance ranges of molecular oxygen and atmospheric water vapor, the least absolute error of approximating the total heat flux qhe by the brightness temperature Tb is of 26–28 W m-2 for a flux variation amplitude of 320 W m-2.
The relative variations of the regression coefficients c1 and c2 are of 13–15%, with the regression coefficient c2 being negative in both cases. This means that the heat flux and the brightness temperature vary in antiphase: an increase in the parameter qhe causes Tb to decrease and vice versa. It is remarkable that the intensity variations of the SOA natural microwave radiation correlates well with variations of the heat fluxes in this case, although the accuracy of finding the brightness temperature and especially the heat fluxes is not very high. The relative error involved in the model brightness temperature values found under the hydrometeorological conditions of the ATLANTEX-90 experiment is estimated as 5–10%, while that of the heat fluxes determined by the bulk-parameterizations may be as great as several tens of percent [4]. This factor substantiates the idea of using passive MCW radiometric data as natural characteristics of ocean-atmosphere heat interaction.
4. On the mechanism of a correlaton between the SOA brightness temperature and surface heat fluxes
The problem of how the SOA brightness temperature (simulated or satellite-measured), for which an effectively radiating 2- to- 5-km-thick stratum is responsible, can be related to the temperature and humidity properties of a much thinner (roughly 10-m-thick) near-water atmospheric layer has been repeatedly discussed by teams at the Institute of Radioengineering and Electronics, Russian Academy of Sciences; the Institute of Space Research, Russian Academy of Sciences; and the Institute of Oceanology, Russian Academy of Sciences.
Here, we will study the importance (priority) of water surface parameters and some parameters of different atmospheric layers, meaning their effect on the correlation between the heat-and humidity exchange characteristics and the MCW radiation of the SOA on the synoptic time scales. To this end, the regression analysis of relationships between variations of simulated brightness temperatures ΔTb and total heat fluxes Δqhe was made basing on the data accumulated from the R/V Volna at the ATLANTEX-90 experiment stationary phase with the following formulas:
|
Δqhe = k1 ΔTi1 + k2 ΔTi2; i = 1,..., 4, |
(3) |
where, the indices 1 and 2 are attached to the SOA brightness temperature of natural radiation in certain pieces of the MCW spectrum characterized by the wavelengths λ1 and λ2; due to the index i we can divide an influence of parameters forming the air-sea heat interaction such as the sea surface temperature Tw (i = 1), the near-surface wind speed V (i = 2) and temperature Ta (i = 3), as well as the total water vapor content Q (i = 4); ΔTi1 and ΔTi2 are the brightness temperature variations at these wavelengths caused by variations of these parameters.
Then, we used the ordered elimination method to reveal the contribution of one or another parameter simultaneously to the heat exchange process and the SOA natural radiation in different parts of the MCW range of wavelengths. Table 1lists the errors due to the approximation of the total heat fluxes qhe by the brightness temperatures of the SOA radiation in the wavelength range 0.56÷3.2 cm.
Table 1. Root-mean-square Errors of Approximation of the Tototal Heat Fluxes by the SOA Brightness Temperatures Simulated with Various Radiation Models (the Generalized Model - the Column “d”, and the Simplified ones - the Other Columns)
Wavelength,cm |
Approximation error, W m-2 |
||||
|
d |
d_Tw |
d_V |
d_Ta |
d_Q |
|
|
0.56 |
27.8 |
27.8 |
28.2 |
48.5 |
27.8 |
|
0.8 |
26.6 |
26.8 |
27.3 |
27.0 |
37.8 |
|
1.35 |
27.0 |
27.2 |
28.4 |
27.5 |
35.9 |
|
1.6 |
26.1 |
26.3 |
27.8 |
26.5 |
35.9 |
|
3.2 |
34.2 |
34.2 |
30.2 |
34.3 |
39.4 |
Here, the column d is
the discrepancy (rms) between the parameter qhe and
the linear combinations of the parameters ΔTi1 and ΔTi2, which value was computed
from the formulas of the least-squares method with taking into account
variations of all the basic parameters of the SOA (Tw, Ta, V, and Q)
in the frames of generalized and simplified radiation models.
In the columns d_Tw, d_V, d_Ta, and d_Q, the effects of the ocean surface temperature Tw, the near-surface wind speed V and temperature Ta, and the integral water vapor content Q, respectively, are excluded (neutralized). Table 2.4 shows that an influence of the sea surface temperature is more easy in comparison with the atmospheric parameters Ta and Q.
We analyzed also the relations between synoptic variations of the parameter qhe and the model estimates of variations of the SOA brightness temperature derived as a result of an imitation of satellite and aircraft measurements with the down-looking MCW sensors, as well as the ship measurements with up-looking (1) and down-looking (2) sensors (antennas): these results are presented in Table 2.
Table 2. Correlation between simulated values of the SOA brightness temperature from various levels of observation at the millimeters and centimeters and the parameter qhe controlled from the vessel Volna in April 1990
|
Wavelength, cm |
Satellite |
Aircraft |
Vessel (1) |
Vessel (2) |
|
0.54 |
0.48 |
0.77 |
0.86 |
0.81 |
|
0.56 |
0.69 |
0.90 |
0.87 |
0.73 |
|
0.59 |
0.92 |
0.89 |
0.85 |
0.71 |
|
0.80 |
0.87 |
0.84 |
0.80 |
0.80 |
|
1.0 |
0.87 |
0.85 |
0.81 |
0.82 |
|
1.35 |
0.83 |
0.86 |
0.84 |
0.78 |
|
1.6 |
0.88 |
0.88 |
0.86 |
0.82 |
|
3.2 |
0.77 |
0.75 |
0.74 |
0.80 |
|
5.0 |
0.74 |
0.73 |
0.72 |
0.70 |
The cells marked in the Table by a bold characterize the correlation equal or above the level 0.8
Computations of the SOA brightness temperatures were performed using the radiation model (1) for the six-hourly samples taken from the measurements of the parameters Tw, V, Ta, and Q observed aboard the vessel Volna at the stationary phase of the experiment ATLANTEX-90.
The results given in Tables 1 and 2 point to the primary role of the parameters Tа and Q in forming relations between the SOA brightness temperatures in the atmospheric resonance lines 1.35 cm and in the regions (5.4–5.9 mm) of the oxygen attenuation (radiation) with the near-surface heat fluxes. This analysis also shows that independently from the methods of observations used (satellite, aircraft, or vessel) an influence of the sea surface temperature on the SOA brightness temperature is the passive factor in comparison with an influence of the atmospheric parameters Ta and Q in the synoptic range of time scales.
Figure 5 compares the values of the atmospheric boundary layer enthalpy (computed from the aerologic sounding data for horizons at an altitude of 10, 100, 200, 300, 400, 500, 600, 900, and 1000 m gathered aboard the Victor Bugaev and Musson vessels) with the total heat fluxes during the passage of a deep cyclone (the ATLANTEX-90 stationary phase; April 8–13, 1990).
|
|
|
|
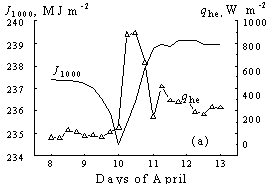
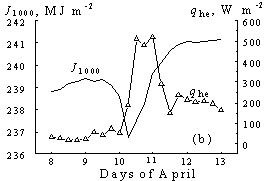
Fig. 5. Total heat fluxes qhe vs. the enthalpy J1000
of the ABL during the passage of a cyclone (April 8-13, 1990) through the location
of the (a) V. Bugaev and (b) Musson R/Vs
Figure 6 compares the values of qhe, with the brightness temperatures at a wavelength of 5.9 mm, and 1.35 cm) obtained aboard the Victor Bugaev and Musson vessels.
|
|
|
|
|
|
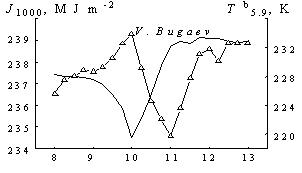
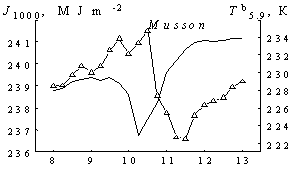
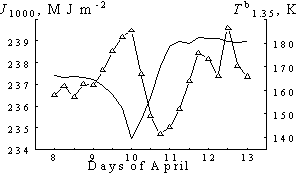
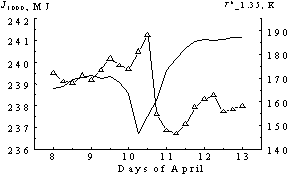
Fig. 6.
Results of modeling the response of the SOA brightness temperature at the
wavelengths 5.9 mm and 1.35 cm to variations of the ABL enthalpy J1000
during the passage of a cyclone (April 8-13, 1990) through the
places of locations of the R/Vs V.Bugaev and Musson
Based on the results of analysis performed in various North Atlantic regions over different time periods, one may safely suggest that the enthalpy variation in the atmospheric boundary layer due to the horizontal heat-and-moisture transfer (advection) controls the variability of heat-and-moisture exchange between the ocean and atmosphere and also specifies the SOA brightness temperature. In addition, the enthalpy variation defines the relationship between them on the synoptic scale. Some issues, such as the delay between the response of the system BT to the variation of the thermal conditions due to the horizontal and vertical heat fluxes in the water and boundary atmospheric layers, need special investigation.
To date, we have gained experience in solving such problems by mathematically simulating the turbulent vertical and advective horizontal heat and appropriate electromagnetic fluxes in the SOA and in analyzing their interplay on the daily scale [7, 8].
5. Experimental studies of intercorrelation between the brightness temperature and synoptic heat fluxes
The multichannel radiometer SSM/I (Special Sensor Microwave/Imager) is one of the best satellite passive microwave radiometric systems operated in the last 13 years within the framework of Defense Meteorological Satellite Program - DMSP), designed for the long-term monitoring of the Earth to provide US Forces with global meteorological, oceanographic, and solar-geophysical information [9] (in December 1992 the DMSP data were declassified and become available for the civil and scientific community). The operative satellites of the DMSP series have a solar-synchronous low circular orbit close to the polar titled by 98.80 with an altitude of about 850 km and period of 102 min (14.2 circuits per day). Presently, several satellites of this series (F-10, F-11, F-12, F-13, F-14, and F-15) are actively operating in space with for last years.
The radiometer SSM/I of the satellite F-08, which is out operation since December 1991 was of a particular interest in our investigations, because it was the only satellite microwave radiometric means of the Earth observation in 1988 and 1990 years during the wide-scale experiments NEWFOUEX-88 and ATLANTEX-90 experiments. This device was designed for the global and synoptic sounding the atmospheric liquid water content in clouds (parameter W), precipitation intensity I, water vapor integral content (parameter Q) wind speed (parameter V), and different land and ice cover parameters. This is a scanning seven-channel four-frequency system under the angle of 520 at the horizontal and vertical polarizations (see its parameters in Table 3) for measuring the SOA brightness temperature in a view band of 1400 km providing global coverage of the Earth in three days and incomplete coverage in a day [10].
In this time the research vessels were settled in three areas of the Gulf Stream delta: in the southern periphery of the basic Gulf Stream water flow (R/V Victor Bugaev), in its southern stream (R/V Musson), and in the eastern branch of the Labrador Current (R/V Volna). This zone is characterized by a strong synoptic variability of the oceanic and atmospheric parameters, which is caused by an influence of the subpolar hydrological front as a result of interaction between the cold Labrador Current and the warm quasi-stationary anticyclone rings of the Gulf Stream. The important attribute of this zone is an intensive horizontal circulation of the atmosphere - about 50% of all the time this area of the North Atlantic feels an influence of the powerful mid-latitude cyclones, which excite intensive variations of the atmospheric temperature and humidity as well as the boundary heat fluxes [4].
Table 3. Main Parameters of the SSM/I Radiometer
|
Frequency, GHz |
19.35 |
22.235 |
37.0 |
85.5 |
|
Wavelength, cm |
1.55 |
1.35 |
0.81 |
0.35 |
|
Polarization (V/H)* |
V, H |
V |
V, H |
V, H |
|
Symbol of channels used |
19.35 V(H) |
22.2V |
37 V(H) |
85.5 V(H) |
|
Spatial resolution, km |
43 х 69 |
40 х 60 |
29 х 37 |
13 х 15 |
|
Sensitivity, K |
0.7 |
0.7 |
0.4 |
0.8 |
*V – vertical polarization, H - horizontal polarization
The following parameters in each vessel experiment were selected for further analysis:
- hourly values of sea surface temperature Tw, near-surface air temperature Ta, humidity (vapor pressure) e and wind speed V derived from hydrological and meteorological measurements (more than 1000 measurements with 1-h resolution);
- results of aerologic measurements of total atmospheric vapor content Q within 10 – 16000 m at 20 levels with periodicity 6 hours (more than 200 aerologic measurements);
- hourly estimates of turbulent heat fluxes qh and vapor qe parameterized from hourly measurements of the parameters Tw, Ta, V and e.
The fragment of stationary phase of the experiment ATLANTEX-90 (from 8 to 13 April 1990) was analyzed in details because just in this period one could see a synchronous response of all vessel oceanographic and meteorological sensors on the strong mid latitude cyclone in this area of the North Atlantic.
With these data we compared the simulated SOA brightness temperatures evaluated from the vertical observations (toward the nadir) in oceanic areas where the R/Vs V.Bugaev, Musson, and Volna resided with simultaneous microwave radiometric measurement data derived from the SSM/I radiometer of the F-08 satellite during the stationary phases of NEWFOUEX-88 and ATLANTEX-90 experiments For this purpose, we analyzed data of the MSFC (Marshall Space Flight Center) archive and selected some its fragments corresponding to surveys made in the areas of location these vessels during March 3-23 1988 and April 4-21 1990. It was has been a good correlation between simulated and satellite estimates of the SOA brightness temperature at the wavelengths 8 mm – 1.55 cm [11, 12].
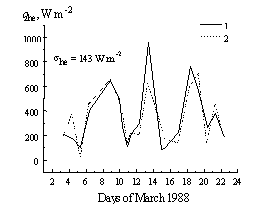
Fig. 7. Comparison of total heat fluxes qhe parameterized from vessel measurements (1) and their estimates (2) derived from the SSM/I channels 22V (1.35 cm), 1.55V, and 1.55H (19GHz). Vessel V. Bugaev
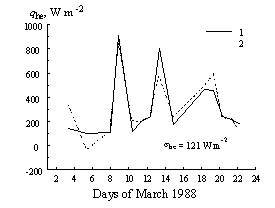
Fig. 8. The same as in the Fig. 8, but for the vessel Musson
Figures 7 and 8 show the results of applying this technique to the data of synchronous measurements from the satellite F-08 and weather research vessels Victor Bugaev and Musson in the stationary phase of the NEWFOUEX-88 experiment.
The stability of relations between the total heat fluxes and their satellite microwave radiometric estimates constructed by linear regressions applied to the data from the channels 22V, 37V,H, and 19V of the F-08 SSM/I radiometer is readily apparent from comparing the parameter qhe and qhe* that were determined with a two-year shift in time (i.e., during the NEWFOUEX-88 and ATLANTEX-90 stationary phases) in nearly the same areas of the Newfoundland EAZO (Fig. 9) for vessels Musson and Volna.
|
|
|
|
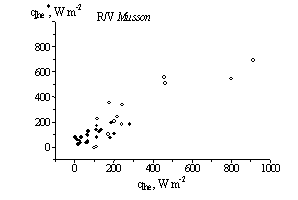
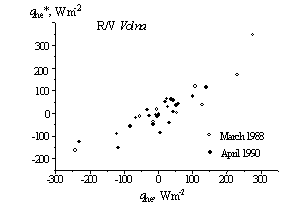
Fig. 9. Results of comparison the data of direct measurements the total heat fluxes qhe and their satellite estimates qhe* resided to the regions of the R/Vs V.Bugaev, Musson, and Volna at the stationary phases of the experiments NEWFOUEX-88 (March of 1988) and ATLANTEX-90 (April of 1990)
6. Conclusion
The brightness temperature of natural microwave radiation of the system “ocean–atmosphere” (SOA) measured from satellites in the resonant absorption bands of water vapor (1.35 cm) and molecular oxygen (5 mm) allows researchers to quantitatively estimate the intensity of vertical turbulent fluxes of sensible and latent vertical turbulent heat fluxes in the “thin” (in terms of the satellite scale) water atmospheric layer over different time intervals. The integral heat fluxes in the entire ocean–atmosphere system and the local heat and moisture fluxes at the ocean–atmosphere interface are related through the air moisture A relationship between the SOA brightness temperature and vertical interfacial turbulent fluxes at middle latitudes of the ocean is governed largely by horizontal fluxes (advection) of moisture and heat in the boundary atmospheric layer. This effect is responsible for a direct correlation between the SOA brightness temperature and the boundary heat fluxes.
Last years, we have ascertained that some peculiarities recognized for the North Atlantic cyclones are proper for the tropical cyclones also. We have been discovered a lot of regularities seen by microwave radiometric sensors, they are stated in [13, 14].
Acknowledgments
The authors are indebted to N.K. Shelobanova (Kotel'nikov Institute of Radio Engineering and Electronics, Russian Academy of Sciences) and S.K. Gulev (Institute of Oceanography, Russian Academy of Sciences) and I.V. Cherny (Roskosmos) for an assistance and cooperation in this work.
References
[1] W.T. Liu, “Moisture and latent flux variabilities in the tropical Pacific derived from satellite data”, J. Geophys. Res. Vol. 93, pp. 6749-6760, 1988.
[2] A.G. Grankov, “Microwave-radiometric diagnostics of integral fluxes of sensible heat at the ocean-atmosphere boundary”, Izvestiya, Atmosph. Oceanic. Phys., vol. 28, no. 12, pp. 883-889, 1992.
[3] A. G. Grankov and E.P. Novichikhin, “Formulas oh heat and moisture exchange between ocean and atmosphere used in radiometric satellite data assimilation”, Russian Meteorology and Hydrology, Allert. Press, no. 1, pp. 61-68, 1997.
[4] S.K. Gulev, A.V. Kolinko, and S.S. Lappo, Synoptic Interaction of Ocean and Atmosphere in Middle Latitudes, St. Petersburg, Russia: Gidrometeoizdat, 1994, in Russian.
[5] S.K. Gulev, Yu.A. Ivanov, A.V. Kolinko, et al., “Experiment ATLANTEX-90”, Meteorol. Gidrol., no. 5, pp. 51-61, 1992, in Russian.
[6] Turbulent fluxes of heat, moisture, and momentum over the sea: Methods of Calculation Leningrad, Russia: Main Geophysical Observatory, 1981, in Russian.
[7] A.G Grankov and Yu. D. Resnyanskii, “Modeling the response of the system ocean-atmosphere natural radiation to the pertrubation of a thermal equilibrium at the interface”, Russian Meteorology and Hydrology, Allert. Press, No. 11, pp. 57-65, 1997.
[8] A.G. Grankov, Ju.D. Resnyanskii, E.P. Novichikhin, and A.A. Milshin, “Modelling the response of the system ocean-atmosphere natural radiation to the horizontal transfer of heat in the atmospheric boundary layer”, Russian Meteorology and Hydrology, Allert. Press, 2014, in press.
[9] H.J. Kramer, Observation of the Earth and Environment - Survey of Missions and Sensors. Second Edition. Berlin, Germany: Springer-Verlag, 1994.
[10] P.H. Hollinger, J.L. Peirce, and G.A. Poe, “SSM/I instrument evaluation”, IEEE Trans. Geosci. Remote Sens. vol. 28, pp. 781-790, 1990.
[11] A.G. Grankov and A.A. Milshin, “Analysis of the factors exciting the ocean-atmosphere heat interaction in the North Atlantic with satellite and vessel data”, Int. J. Remote Sensing, vol. 31, pp. 913-930, 2010.
[12] A.G. Grankov and A.A. Milshin, Microwave Radiation of the Ocean-Atmosphere: Boundary Heat and Dynamic Interaction, Berlin, Germany: Springer, 2010.
[13] A.G. Grankov, S.V. Marechek, A.A. Milshin, E.P. Novichikhin, and N.K. Shelobanova, “Analysis of prestorm situations in the Florida Straight and Golubaya Bay in the Black Sea”, Izvestiya, Atmosph., Oceanic Phys., vol. 50, no. 1, pp. 85-91, 2014.
[14] A.G. Grankov, A.A. Milshin, and E.P. Novichikhin, “Behavior of the brightness temperature of the system “ocean-atmosphere” under midlatitude and tropical cyclones activity”, Radiophysics and Quantum Electronics”, 2014, in press.