USING OF SAR DATA AND DINSAR-PSINSAR TECHNIQUE FOR MONITORING OF WESTERN SIBERIA AND ARCTIC
V. M. Bryksin, A. V. Filatov, A. V. Yevtyushkin
Immanuel Kant Baltic Federal University, Kaliningrad
Received June 5, 2012
ИСПОЛЬЗОВАНИЕ РАДАРНЫХ ИЗОБРАЖЕНИЙ И DINSAR-PSINSAR ТЕХНОЛОГИИ ДЛЯ МОНИТОРИНГА ЗАПАДНОЙ СИБИРИ И АРКТИКИ
В. М. Брыксин, А. В. Филатов, А. В. Евтюшкин
Балтийский федеральный университет им. И. Канта, Калининград
Abstract. Results of application of the DInSar and PSInSar methods of interferometric processing of radar data for monitoring of subsidence of a terrestrial surface in areas of oil and gas production of Western Siberia are presented. Features of reception and initial data handling of ERS-2\SAR on the antenna TNA-9 complex are considered. Results of processing of a series of the multi-temporal these sensors of ERS-2\SAR, ENVISAT\ASAR, ALOS\PALSAR on the basis of the developed software of PSI technique in the environment of MatLab on high-productive distributed computing cluster are given. For processing of radar images are used this synchronous sub-satellite of measurements.
Keywords: radar interferometry, corner reflector, SAR, ASAR, PALSAR, GeoServer, geodynamic polygon, subsidence, mould.
Аннотация. Представлены результаты применения методов DInSar и PSInSar интерферометрической обработки радарных данных для мониторинга просадок земной поверхности в районах нефтедобычи Западной Сибири. Рассмотрены особенности приема и первичной обработки данных ERS-2\SAR на приемный комплекс ТНА-9. Приведены результаты обработки серии многовременных данных сенсоров ERS-2\SAR, ENVISAT\ASAR, ALOS\PALSAR на основе разработанного программного обеспечения метода PSI в среде MatLab на высокопроизводительном распределенном вычислительном кластере. При обработке радарных изображений использованы данные синхронных подспутниковых измерений.
Ключевые слова: радарная интерферометрия, уголковый отражатель, SAR, ASAR, PALSAR, GeoServer, геодинамический полигон, просадки, мульда.
Introduction
Results of processing of radar data are given in work on the territory of Siberia and Arctic, and also application of the presented results for long-term monitoring of offsets are given in areas of intensive oil and gas production.
Earlier authors showed possibility of application ALMAZ-1, SIR-C, JERS-1 radar images for identification of specific structure and damages of forest, selections of glacial moraines complexes in mountains, detection of traces of catastrophic water streams [1-9]. The great attention is given to development of methods of airplane microwave radiometry of moisture of the soil, soil salt definition, measurements of levels of ground waters [10-12].
Field supervision and sub-satellite of measurement of characteristics of open rocks, soil and vegetation were carried out on the polygon created for the NASA programs: test site E-80 «Altai» for mission «SIR-C» STS-59 и 68 (April and October, 1994), «SRTM» STS-99 (February, 2000). Also test site «Altai» survey from satellites of remote sensing of Earth in optical band was carried out. Survey by radar «ALMAZ-1» and synchronous field measurements of moistness of soils and supervision of a roughness of opened fields are executed on October 26, 1991 [13].
Results of investigations into thematic interpretation of orbital images recorded with the SIR–C/X–SAR radar with synthetic aperture in the L- and C-bands for HH, VV, and HV polarization states are given. Problems of recognition of characteristics of forest and agricultural vegetation, erosion processes of soil on the regional scale on the plain and foothill territories of the Altay region are examined. Influence of filtration of the speckle noise is studied and images are classified by the kernels in the contrast - mean intensity space. Results of classification have been compared with the ground-based data and orbital scanning and photographic images obtained in the optical range.
The comparative analysis of results of identification of glacial relief forms on perspective images constructed with use of space images and 3D models relief of maps constructed on basis of heights, showed that authentically glacial moraines are allocated, if spatial resolution of digital model of a relief coincides with space distribution of image.
Results of digital processing of spring and autumn amplitude images of SIR-C and land supervision are compared. The capability application of the radar and optical space images for a decoding of surface relief of high terraces Biya and Katun rivers after passage of catastrophic water flows is considered.
Use of MSU-E and MSU-SK optical images and ERS-2\SAR radar amplitude data for monitoring of grain cultures in Altai region was considered [14-15]. The capabilities of interpretation and processing of the images together with model of bio efficiency are investigated. The reliability of results was confirmed by sub-satellites ground experiments in 1998-2001.
The main advantage of satellite radar is possibility of obtaining images irrespective of cloudiness and conditions of solar irradiating. However technical features of formation of radar dates don't allow to use completely the methods of interpretation applied to photographic and multispectral space images.
As part of the studies of ice cover «seismic activity» and its communication with deformations on the interblock boundary the technique of differential interferometry, speckle-tracking method and the textural analysis of radar images ALOS\PALSAR along the southern part of Lake Baikal during the freezing-over period 2008–2011 was developed [16]. The speckle-tracking method has appeared to be most productive for the estimation of horizontal motions of ice areas.
Oil and gas reserves on the territory of Western Siberia are extracted in area of continuous and discontinuous permafrost, peat bogs, fully-frozen in winter shallow lakes, thermokarst provinces and in zone of ravine erosion as a result of technogenic top-soil failure [17].
Negative geodynamic processes cause pipeline breakings at different depths in wells on active oil-and-gas fields, intrafield and main ground-surface pipelines. As a result of the spatial analysis of breakdown susceptibility of pipelines in connection with a site of local breaks it has been established, that a repeating breakdown susceptibility of oil pipelines is dated for these local breaks. From the point of view of physics and the geomechanics, studied structures prove as dynamically deformation processes, however without explosive infringements of thickness of breeds. Many researches show, that influence of local breaks of an earth crust on pipelines considerable, and can lead to destruction of pipelines.
At the same time nature landscape features presented in that area place a certain limitation on interferometric processing and require more detailed data analysis. The main objective of the research work is construction of displacements maps of ground surface and detection of subsidence’s that have a negative impact on objects of oil and gas production. The complex of the researches spent using remote sensing data is addition to the land geological and geophysical works which are carried out by oil-extracting companies.
Differential radar interferometry is an effective method for estimation of plane and vertical displacements caused by breakdown structure movements. At the same time nature landscape features presented in that area place a certain limitation on interferometric processing and require more detailed data analysis. Method of Persistent Scatterers Interferometry allows counting velocity of displacements in isolated bright points on the basis of a set of repeated radar imaging.
The scientific side of work consists in research, developing and implementation of methods of processing of radar measurements in the conditions of high temporal decorrelation. The practical side is connected with monitoring of a surface of oil and gas deposits and detection of motions caused by hydrocarbons extraction.
During the research work ERS-2\SAR, ENVISAT\ASAR and ALOS\PALSAR radar data were used. The estimation of applicability of C-band and L-band radar data based on coherence distribution is made. Complex analysis of temporal and spatial decorrelation depending on sensing conditions, sensing season and different natural landscapes of Western Siberia revealed the advantage of L-band radar data for research territory. PALSAR data allowed constructing displacements maps reflecting the ground surface dynamics of Samotlor oil field and Gubkin gas-condensate field during the 2006–2011 period. GPS measurements on points of geodynamic polygons were used as ground control points during differential interferometric processing. Joint analysis of spatial profiles and displacements maps on territory of Samotlor and Gubkin deposits shows decreasing of subsidence forming the trough.
ERS-2\SAR data acquiring, processing and sub-satellite interpretations
Per 2005-2011 years Remote Sensing Center of Ugra Research Institute of Information Technologies (URIIT) on Khanty-Mansiysk regular reception of all-weather radar images from ESA satellite ERS-2 is carried out. Space images ERS-2\SAR and also AQUA, TERRA\MODIS receiving on OPTECS and TNA-9 antenna complexes. The strip of image of scanner SAR makes 100 km, resolution of 12.5 m, an interval between strips of overlapping of 3 day, standard period of recurrence sub-satellite lines of 35 day, an interval of recurrence of orbit with overlapping in half of staff of 17 day. Sessions are accepted by duration till 10 minutes that corresponds to extent of 4000 km. The sensor from the lengthiest wave of 5.6 cm (C-band) and polarization of VV carried out sensing twice a day in morning and night orbits.
The ERS-2 demodulator is provided by the ESA for execution of research grants of Category-1. Time expenses for construction of one georeferenced SAR scene the following: generation in format PRI from the initial radar hologram on specialized Silicon Graphics Challenge Server - 60 minutes, geotransformation in package IDL 6.2 on supercomputer SUN FIRE 15K - 15 minutes, additional georeferenced in interactive mode on reference points with use LANDSAT-7 images - 15 minutes. In figure 1 the mosaic covering of Western Siberia from occurring at different times orbit ERS-2 in 2005-2006 year is resulted.
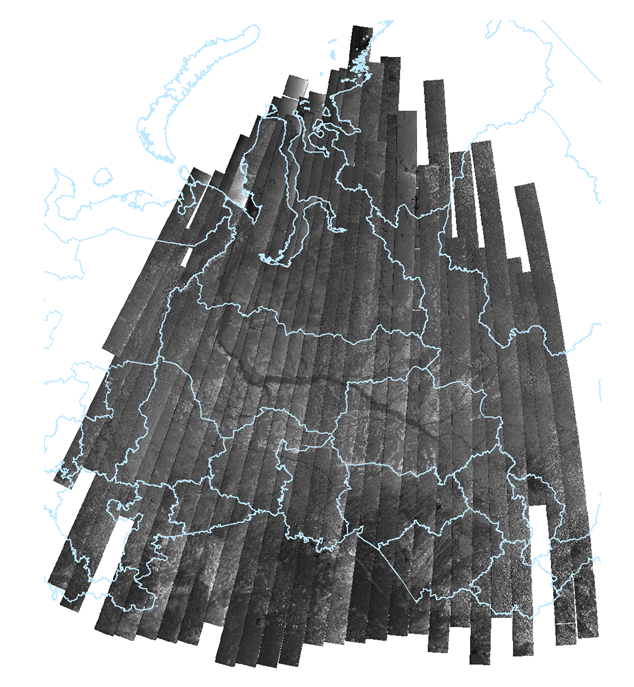
Figure 1. ERS-2\SAR images coverage on Western Siberia from July 2005 to September 2006.
In language IDL software is developed for batch transformation of standard scene in size of 100*100 km in projection UTM and operative construction geocoded quick-looks with resolution 150m [18]. The software is developed for batch transformation ERS-2 scene 100*100 km of size in projection UTM. For construction of full multi-time covering of territory following kinds of processing are carried out: overlay in mosaic of geotransformed scene, correction of geocoding references overlays strips for each orbit for concurrence of occurring at different times orbit to within pixel. In a figure 2 results of shooting with overlapping in 3 days are provided.
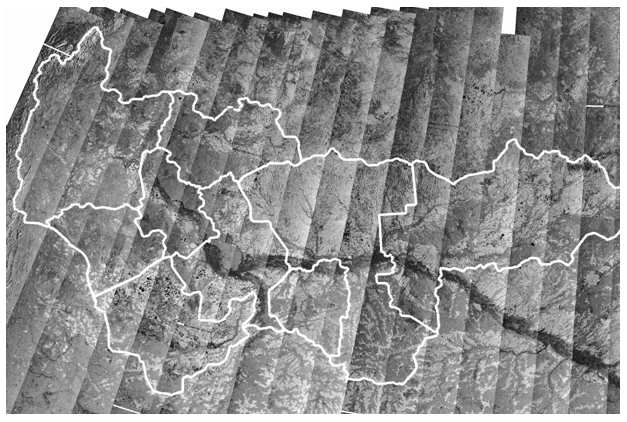
Figure 2. ERS-2\SAR images coverage on Ugra region with overlapping in 3 days in the summer 2005.
Field researches and overseeing in sub-satellite experiments by a condition of vegetative covers, forest, ice situation on the rivers, regions of oil spill on soil and bogs for working off of technology satellite monitoring of long distance pipe lines were carried out [19-21]. Detailed research of structure of vegetative covers (fig. 3) in the south of Western Siberia were carried out in 2006 and 2010 [15].
Field supervision for decoding specific structure of vegetation’s in radar images ERS-2 were spent per 2006 synchronously with space observations in various areas of Novosibirsk and Altay territory. It is established, that color RGB synthesis from pictures executed in June, July and August on the same territory allows to divide following cultures visually: sunflower, wheat, corn, millet [15]. Wheat and an oats that is connected with concurrence of phenological phases of development cultures are not divided. At inclusion in color synthesis of pictures for May and September steam fields, vegetative rests and natural not opened steppe used under a pasture are authentically allocated.
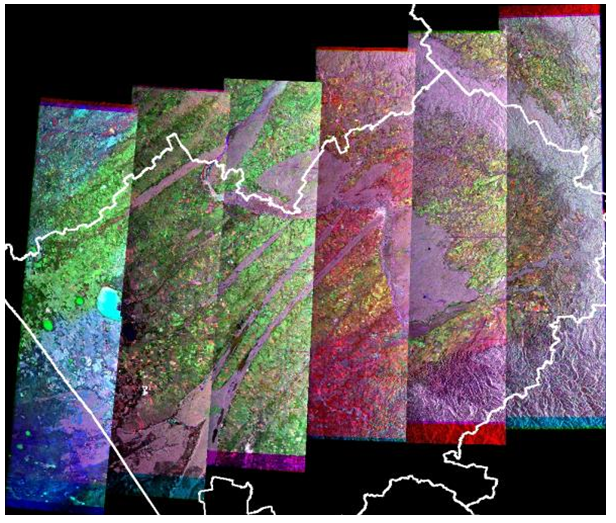
Figure 3. 35-day repeat cycle ERS-2\SAR multi-temporal images color composite coverage on Altai region from July to October 2010.
Distortions due to local deposits of fields which have dropped out on separate groups have not allowed to use image ERS-2 for August, 14th for correct decoding specific structure grain crops on greater areas. The damp ground is allocated in the form of strips with extent up to 200 km. More strongly this effect is shown on salted soils and observed on the cleaned fields in autumn of 2005-2010 years on ERS-2\SAR images on regions of East Ural, Northern Kazakhstan and south of Western Siberia. It confirms need of the accounting of earlier studied features of salty soils for anomalously dry condition [22]. Deposits which have locally dropped out on dry ground at strong wind bring distortion in images ERS-2 in form of light strips. It is connected with change of dielectric permeability damp soils and plants. In a figure 3 to the region of salty and dry chestnut soils correspond dark blue color in a south-west part of coverage image of 2010. The color composite covering is created on the basis of SAR_PRI data for three dates during the period from July to October, 2010.
RGB color composite ERS-2\SAR images for different dates display variety phenological phases of development of grain crops in various climatic zones of Western Siberia. Distinctions are connected with terms of sowing in connection with long spring and non-uniformity of loss of rain on territory in year months. Groups of fields with one culture and separate steam fields are authentically allocated. Occurring at different times data of all-weather space radar ERS-2 of mid-resolution allow to define specific structure of cultures, to within field, for all territory of Western Siberia in rainy years with greater number cloudy days. For various climate zones attraction of the information from test sites and expert estimations on accommodation of basic cultivated cultures is required.
During an ice drift and ice formation per 2006-2010 analysis of a condition of an ice surface of rivers Ob and Irtysh, Ob gulf and Kara sea water area under radar images ERS-2\SAR and optical images of scanner MODIS with resolution 250 m from satellites TERRA and AQUA was spent. Time interval between flights of satellites in the morning made 10-30 minutes. It is lead ground visual decoding synchronous with radar images on distance of 20 km from of city Khanty-Mansiysk on rivers Ob and Irtysh. It has allowed establishing unequivocally, that dark sites correspond to a smooth snow ice crust on river to an ice and shallows, and light - to ice hummocks in height up to 0.7 m snowdrifts on fine hummocks.
On radar image ERS-2 for March, 3rd sites of ice hummocks are more contrast, than in a picture for April, 7th. From ground supervision in April also it is visible, that there is a destruction of ice hummocks and simultaneously the roughness on snow ice crust due to thawing increases. As a result contrast on executed after approach of thawing weather radar images ERS-2 between sites of hummocks both an equal ice and a snow decreases. Ice-holes on the rivers in it are abnormal cold winter of 2005-06 with temperatures up to -49 degree are not found out.
All-weather radar images ERS-2 during an ice drift in May, 2006-2010 were operatively processed and transferred within 2 hours after flight of satellite in EMERCOM KhMAO-UGRA region administration for decision-making on a degree of danger of flooding. Georeferences with topographic map geocoded and contrasted images ERS-2 combined with a map allow experts to hydro broad gullies to map authentically places of a congestion of an ice both pure water at any time and a continuous cloudy cover (figure 4).
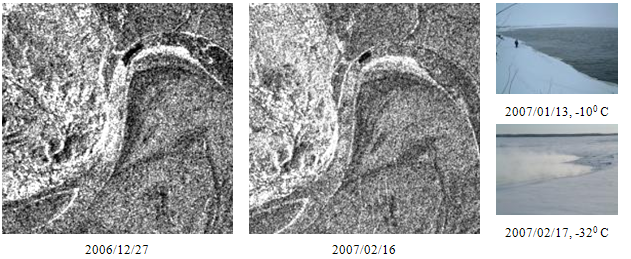
Figure 4. Ice-hole and hummocks on river Irtysh by ERS-2\SAR and surface survey.
ERS-2/ENVISAT tandem campaign was carried out from August 2008 until April 2009 and from July 2010 until November 2010. Remote sensing center of URIIT acquired satellite data ERS-2\SAR out of a zone of the review of ESA stations on territory south Western Siberia and central East Siberia. Further SAR data were transferred to ESA-ESRIN on DLT tapes.
From March 11 to July 7, 2011 the ERS-2 satellite change orbit was transferred by a way to 3-days repeat cycle. Remote sensing was carried out on restricted number of orbits and territories [23]. In this mode of radar temporary and spatial decorrelation of terrestrial covers decreased. There was a possibility to study fast-flowing past planned and high-velocity moving’s of terrestrial covers in north of Western Siberia and Arctic. In a figure 5 the interferogram constructed on radar data with an interval of 3 days of acquired at URIIT (KM station on figure 5) is shown. Also short term displacements of frozen soils (figure 6) are revealed on the peninsulas of Yamal, Gydansky, Tazovsky where it is located big purely developed gas fields and gas pipelines [19, 21].
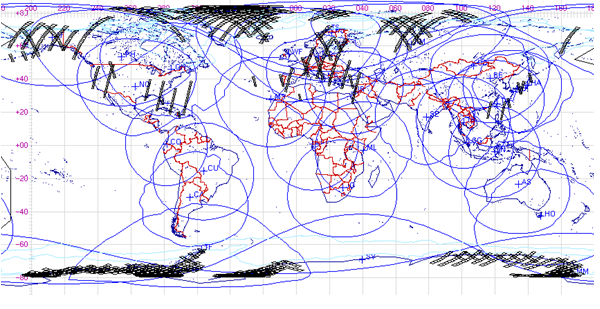
Figure 5. ERS-2\SAR acquisition plan by 3-day repeat mode.
More than 76000 scenes are acquisitions and saved on 560 DLT tapes. The covering territory data of ERS-2\SAR stretches from Norway to Baikal. Input data’s on streamer tapes are used for synthesis of images in the formats RAW, SLC, PRI. All ERS-2\SAR data and Silicon Graphics Challenge Server also are transferred officially by European Space Agency for further processing and scientific use in Baltic federal university in 2011.
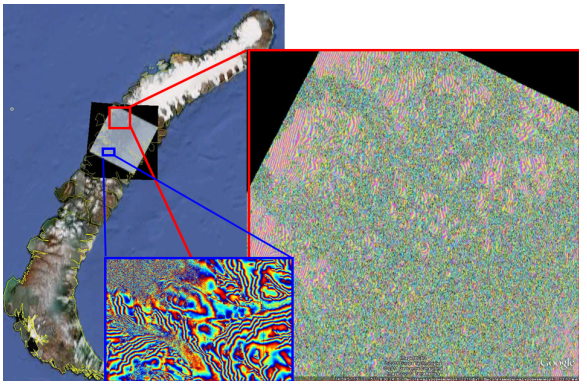
Figure 6. ERS-3\SAR interferogram (15.03-18.03.2011) on site with frozen soil, permafrost and ice displacements and moving on island Novaya Zemlya.
Archiving of ENVISAT and ALOS radar data
In this work data of radar satellites ENVISAT, ALOS are used. With the support of the grant of European Space Agency ESA ENVISAT-AO ID 365 the archive consisting of 57 ENVISAT\ASAR radar scenes received from 2003 till 2004 is ordered. Sensing was made using Image Mode (IM) with vertical polarization combination (VV, C-band), spatial resolution 12.5 m and swath width 100 km and the minimum temporal baseline is 35 days. Images cover the most part of Khanty-Mansiyskiy Autonomous Okrug (KhMAO-Ugra), basically territories of intensive oil extracting, and also a permafrost zone behind northern border of the region. On figure 7 show result InSar processing ENVISAT\ASAR on 09.08-13.09.2004 for DEM generations.
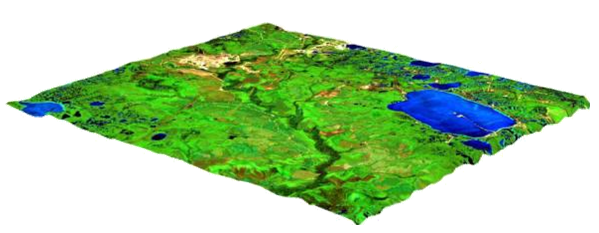
Figure 7. 3D view of Fedorov oil field: ASAR DEM dropped ETM.
The archive of ENVISAT ASAR Wide Swath Mode imagery of medium resolution with complete number of scenes 9300 and volume 1.5 Tb is accumulated. In realization of a grant ESA.C1P.9359 data in WSM format of were available 30 minutes after the completion of reception through FTP protocol in acquireon centers for ESA - Kiruna, Matera, ESRIN. In figure 8 fragment of amplitude image with resolution of 75 m to Baltic Sea is presented.
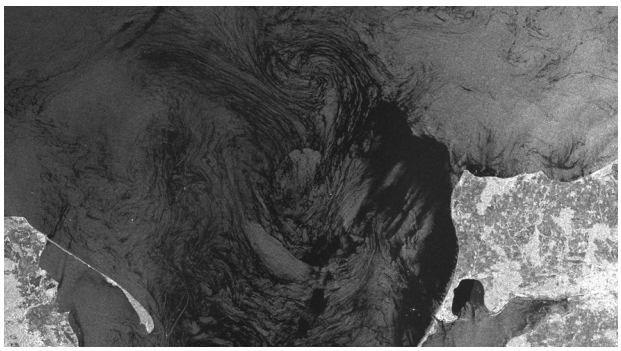
Figure 8. Wind situation on sea surface in ENVISAT_WSM from 5.06.2011
With the support of the grants of Japan Aerospace Exploration Agency 340 scenes which have been received in 2006-2011 according to the ALOS observation strategy, are ordered. Parameters of the PALSAR sensing signal: wave length is 23cm (L-band), sensing mode is Fine Beam, incidence angle is 38 degrees, maximum spatial resolution is 5 m or 10 m and the minimum temporal baseline is 46 days.
Using PALSAR data acquired during 2007-2010 digital elevation models of all research regions were constructed (figure 9). During interferometric processing and digital elevation model generating correction using ground reference control points was carried out. Triangulation points and height marks presented on topographic maps of scale 1:50000 were used as ground reference points. Digital elevation model of ground surface generated using this approach reflects height of relief taking into account envelope of vegetation covers predominant on this territory. All digital elevation models were converted from radar azimuth slant range coordinates to UTM projection with proper zone. Accuracy on height makes 10 m.
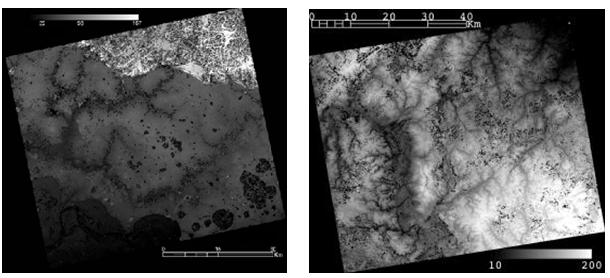
Figure 9. PALSAR digital elevation model: a) Samotlor oil field b) territory along trunk oil and gas Beloyarskiy pipeline.
Regions selected for research are either great oil and gas fields or important oil and gas production objects. Also significant argument was availability of additional data and earlier made investigations. First area were used as a test polygon for different methods and ideas checking. More detail processing was carried out for Samotlor oil field and additional Gubkin gas field located in Yamalo-Nenetskiy autonomous Okrug. On territory of this deposits geodynamic polygons were developed and much volume of additional ground measurements data is available.
In the research work PALSAR data of two observations modes were used:
- Fine Beam Single (FBS): spatial resolution ~5m range, 4.5m azimuth, acquisition during snow season;
- Fine Beam Dual (FBD): spatial resolution ~10m range, 4.5m azimuth, acquisitions during snowless season;
- Only HH (radiating and receiving and horizontally polarized signal) polarization mode were used.
For the current time in connection with the termination of a resource of serviceability radar satellites finished work in an orbit: ALOS - on April 22, 2011, ERS-2 - on July 7, 2011, ENVISAT - on April 8, 2012.
Main principles of radar interferometry used on research
The method satellite radar interferometry uses effect of an interference of electromagnetic waves and is based on mathematical processing of several coherent amplitude and phase measurements of the same site of ground surface with shift in space of the receiving antenna of radar. Two or more images received by the sensor at repeated flight of the space vehicle over the same territory are used for this purpose. As a result of manipulation with phase components of radio signals it is possible to obtain elevation of one resolution element relative to another from what further to construct digital elevation model with reference to reflective surface, and also to estimate the changes of the elevation which have happened in time between acquisitions. The method of interferometric processing is a powerful tool which is well described in many books and papers [24-26]. The short description of principles of radar interferometry made on the basis of the used scientific literature is given below.
The interferogram is generated by multiplication of two radar images presented in complex values:
![]()
where ![]() is the complex interferogram,
is the complex interferogram, ![]() is the radio signal in complex values
received during first (master) acquisition,
is the radio signal in complex values
received during first (master) acquisition, ![]() is the
complex-conjugate signal received during second (slave) acquisition,
is the
complex-conjugate signal received during second (slave) acquisition, ![]() ,
, ![]() are
amplitudes of the signals,
are
amplitudes of the signals, ![]() ,
, ![]() are phase values of the signals,
are phase values of the signals, ![]() – is the resultant interferometric phase.
– is the resultant interferometric phase.
The geometrical scheme of calculation
of altitude of ground surface (![]() ) and displacement (
) and displacement (![]() ) in time between acquisition is given in
the figure 10. The used method of interferometric processing allows to
determine the given values on the basis of known arguments: a satellite
position during first acquisition (
) in time between acquisition is given in
the figure 10. The used method of interferometric processing allows to
determine the given values on the basis of known arguments: a satellite
position during first acquisition (![]() ); a relative
positioning of satellites at multi-temporal acquisitions (length and attitude
of a baseline
); a relative
positioning of satellites at multi-temporal acquisitions (length and attitude
of a baseline ![]() ); a difference of distances
from the antenna of a radar to a point on ground surface at repeated
acquisitions (
); a difference of distances
from the antenna of a radar to a point on ground surface at repeated
acquisitions (![]() ).
).
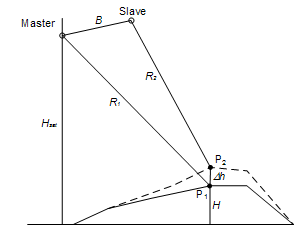
Figure 10. Interferometric configuration of two-pass radar acquisition.
The topographic component of an interferometric phase depends on the relative height of a site of ground surface:
![]()
where ![]() is the wavelength of the sensing signal
(0.23m for used PALSAR data),
is the wavelength of the sensing signal
(0.23m for used PALSAR data), ![]() is the perpendicular
(normal) projection of the baseline,
is the perpendicular
(normal) projection of the baseline, ![]() is the distance
between satellite position during first acquisition and point on ground
surface,
is the distance
between satellite position during first acquisition and point on ground
surface, ![]() is the incidence angle,
is the incidence angle, ![]() is the height of a site of ground surface
over a reference ellipsoid,
is the height of a site of ground surface
over a reference ellipsoid, ![]() is the predetermined
phase calculated from model of a reference ellipsoid.
is the predetermined
phase calculated from model of a reference ellipsoid.
The phase component ![]() is
proportional to displacement
is
proportional to displacement ![]() of a site of ground
surface in time between acquisitions in a line-of-sight direction:
of a site of ground
surface in time between acquisitions in a line-of-sight direction:
![]()
Instruments, defining orbital arguments of satellite motion,
allow to evaluate a position (![]() ) accurate within 1m.
The difference of distances from the antenna of a radar to a point on ground
surface is determined as a phase difference of the radar signals received at
repeated acquisitions. Sensor PALSAR allows to determine plane co-ordinates of
a site of ground surface to within 9.7m. To correlate the produced radar
measurements with a site of ground surface which one in time between
acquisitions in addition to all modified its position from P1 on P2,
co-registration and resampling of radar data are carried out. With the help of
sub-pixel co-registration accuracy of radar frames overlapping reaches 1/10th
of spatial resolution (~10m for PALSAR data).
) accurate within 1m.
The difference of distances from the antenna of a radar to a point on ground
surface is determined as a phase difference of the radar signals received at
repeated acquisitions. Sensor PALSAR allows to determine plane co-ordinates of
a site of ground surface to within 9.7m. To correlate the produced radar
measurements with a site of ground surface which one in time between
acquisitions in addition to all modified its position from P1 on P2,
co-registration and resampling of radar data are carried out. With the help of
sub-pixel co-registration accuracy of radar frames overlapping reaches 1/10th
of spatial resolution (~10m for PALSAR data).
The radar interferometry singularity consists in calculation
of altitudes and displacements of sites of a surface relative to concerning
adjacent, therefore computational values are a little subject to influencing of
orbital errors. Only length and orientation of a baseline (![]() ) exactly their variation along the
satellite orbit can introduce a notable error to the end results. Using
additional ground terrestrial reference points for baseline refinement, it is
possible to make bring accuracy of its determination to 1mm.
) exactly their variation along the
satellite orbit can introduce a notable error to the end results. Using
additional ground terrestrial reference points for baseline refinement, it is
possible to make bring accuracy of its determination to 1mm.
Standard chain of the stages executed during interferometric processing:
- source images co-registration;
- interferogram generation;
- interferogram flattening;
- interferogram filtering;
- coherence map generation;
- interferometric phase unwrapping;
- unwrapped phase editing;
- baseline refinement;
- relative heights computation;
- relative displacements computation.
For elimination of a topographic component in the process of differential interferometry as reference digital elevation models accessible data GTOPO 30, ASTER GDEM, the digitized topographic maps of scale 1:50000 were used. SRTM (Shuttle Radar Topography Mission) don’t exist for this territory.
Also the configuration of radar frames during 4-pass acquisition was used:

where ![]() are interferometric phases for first and
second pairs respectively,
are interferometric phases for first and
second pairs respectively, ![]() are height to phase
conversion factors,
are height to phase
conversion factors, ![]() temporal baselines of first and
second pairs respectively.
temporal baselines of first and
second pairs respectively.
In figure 11 present schemes for ALOS\PALSAR data 3-pass interferometric processing. First stage is the reference digital elevation model constructing based on interferometric pair with spatial baseline 3000m. Second stage is the differential interferometric processing using pair of images with minimal spatial baseline. Topographical component removing is based on reference DEM.
Uncoherent multi-looking of interferogram pixel enables to reduce phase noise due to temporal decorrelation. New filtering technique realized in MatLab allows to re-introduce detail topographic information to the phase image (Dan Meng, The University of New South Wales, Sydney, Australia). Resulting interferogram is generated from 3 multi-looked phase image using coherence value mask.
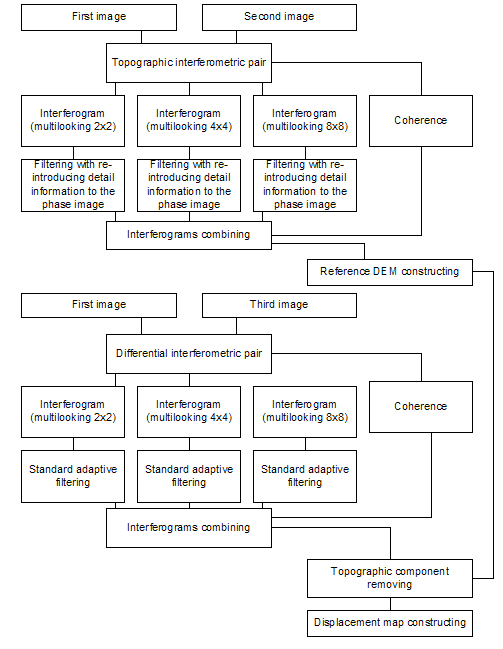
Figure 11. 3-pass interferometric processing scheme.
The original method of interferogram
processing in case of high temporal decorrelation is offered [20]. After interferogram filtering stage phase unwrapping (addition of ![]() value where
value where ![]() is an
positive or negative integer number) is carried out. However significant noise
level due to high temporal decorrelation leads to incorrect algorithm
functioning and so unwrapped interferogram contains phase discontinuities. In
the presented research work to reconstruct absolute phase 3 interferograms
generated with consistent multi-look window size were used. Unwrapped
interferograms is corrected under formula presented below.
is an
positive or negative integer number) is carried out. However significant noise
level due to high temporal decorrelation leads to incorrect algorithm
functioning and so unwrapped interferogram contains phase discontinuities. In
the presented research work to reconstruct absolute phase 3 interferograms
generated with consistent multi-look window size were used. Unwrapped
interferograms is corrected under formula presented below.

where ![]() and
and ![]() are
adjusted phase values;
are
adjusted phase values; ![]() denotes means residue of
division;
denotes means residue of
division; ![]() - denotes the integer part;
- denotes the integer part; ![]() are unwrapped phase values obtained from
interferograms generated with 1x1, 2x2 and 3x3 multi-looking respectively;
are unwrapped phase values obtained from
interferograms generated with 1x1, 2x2 and 3x3 multi-looking respectively; ![]() is the azimuth pixel index;
is the azimuth pixel index; ![]() is the slant range pixel index. The given
formula has correct result provided that during multi-looking fringe integrity
has not been upset.
is the slant range pixel index. The given
formula has correct result provided that during multi-looking fringe integrity
has not been upset.
The final phase value ![]() at each pixel is selected on the basis of
coherence map.
at each pixel is selected on the basis of
coherence map.

where ![]() is the coherence value
at the point with
is the coherence value
at the point with ![]() and
and ![]() coordinates;
coordinates;
![]() are thresholds coherence values (
are thresholds coherence values (![]() ).
).
The threshold values are based on
analysis of the coherence distribution over the scene area. As a result the
final interferogram contains areas with different spatial resolution and height
accuracy. During PALSAR data processing next defaults threshold coherence
values are set ![]() which can be changed depending
on decorrelation influence.
which can be changed depending
on decorrelation influence.
For construction of digital elevation models and calculation of displacements it is necessary to select and order pairs of radar frames with certain arguments of sensing. Critical values in this case are temporal and spatial baselines. Increasing of the first parameter leads to lowering of coherence of radar measurements occurring at different times owing to variations of a vegetative cover and the dielectric properties of reflective surface. Increasing of the second parameter leads to increasing of part of topographic contribution of interferometric phase proportional to reflective surface altitudes.
Radar interferometry method is based on processing of coherent signals reflected from ground surface at various times. The coherence value (from 0 to 1) mirrors the level of corrupting of the interferogram, is calculated as correlation of two signals in complex values and is a standard of operability of pair of frames for the further processing.

where ![]() ,
, ![]() are
the complex values of reflected signals for master and slave frames.
are
the complex values of reflected signals for master and slave frames.
For C-band synthetic aperture radars observation carried out during late spring, summer and early autumn seasons is acceptable for interferometric processing [27-32]. The maximum temporal baseline value at which one there is no interferogram decorrelation amounts 70 days. The distance between a radar antenna at repeated orbits should not exceed 600m, otherwise it leads to corrupting of an interferometric phase caused by spatial decorrelation. It is necessary to note that critical value of normal baseline length for ENVISAT\ASAR (with incidence angle 23° and spatial resolution 30м) amounts 1.1km.
Coherence comparing between pairs of frames received by ENVISAT\ASAR and ALOS\PALSAR and also between ALOS\PALSAR pairs is carried out under various conditions of observation. Co-registration of different coherence maps was based on geocoding using orbital data and observation parameters. Comparing showed that owing to longer wavelength (0.23m) and as consequence higher penetrating effect correlation of ALOS\PALSAR interferometric pairs is considerably higher. This conclusion is confirmed by comparing of coherence maps based on interferometric pairs of frames on territory of the Fedorov oil field given in Tab. 1. Mean value of coherence of ALOS\PALSAR pair is higher despite spatial decorrelation as a result of significant length of the normal baseline value.
Table 1 Comparing of mean coherence of ENVISAT\ASAR and ALOS\PALSAR interferometric pairs acquired in summer seasons with minimal temporal baseline
|
Sensor |
Master |
Slave |
|
|
|
ASAR |
10.07.2004 |
14.08.2004 |
60 |
0.319 |
|
PALSAR |
12.06.2008 |
28.07.2008 |
2323 |
0.451 |
Comparing of coherence maps (Tab. 2) of ALOS\PALSAR pairs on territory of the Samotlor oil field with different spatial baselines, showed the high corrupting of phase of the interferogram owing to spatial decorrelation. In this connection it is not possible to construct digital elevation model of wood territory for which one pairs with a baseline more than 3000m are used.
Table 2 Comparing of mean coherence of ALOS\PALSAR interferometric pairs with long and short normal baseline
|
Sensor |
Master |
Slave |
|
|
|
PALSAR |
19.08.2007 |
04.10.2007 |
419 |
0.584 |
|
PALSAR |
06.07.2008 |
21.08.2008 |
3465 |
0.251 |
Moreover coherence of an interferometric pair with length normal baseline more than 3000m decreasing with increasing of incidence angle. Mean value of coherence at far-range observation area is less by 0.134 than at near-range zone therefore accuracy of height reconstruction reduces with moving away from sensor antenna..
Unlike ENVISAT\ASAR data for ALOS\PALSAR interferometric pairs (Tab. 3) during observation of snow surface it is possible to generate stable (informative) interferogram even with temporal baseline more than 1 year. Values of deformations obtained as a result of interferometric processing of winter season acquisitions reflect movements of earth crust block more accurately due to small influence of seasonal changes of peat bogs surface level.
Table 3 Comparing of mean coherence of ALOS\PALSAR interferometric pairs acquired at snow and snowless seasons.
|
Sensor |
Master |
Slave |
|
|
|
PALSAR |
19.08.2007 |
04.10.2007 |
419 |
0.533 |
|
PALSAR |
18.12.2007 |
02.02.2008 |
789 |
0.471 |
|
PALSAR |
04.10.2007 |
06.07.2008 |
1954 |
0.156 |
|
PALSAR |
30.01.2007 |
18.12.2007 |
2731 |
0.266 |
Thus, application of data acquired with synthetic aperture radar with high wavelength (PALSAR, 0.23m) eliminates small vegetative covers masking influence and allow generating interferogram more inconvertible against temporal decorrelation. High accuracy of digital elevation models is reached because of usage of interferometric pairs of snowless surface with incidence angle from 36.6° to 38.7° (near-range). To estimate long-term ground surface displacements PALSAR data acquired at any season can be used. But the temporal baseline can’t exceed 4 years.
Estimation of relative seasonal displacements of ground
On a basis of pair of ENVISAT\ASAR radar frames (10.07.2004 – 14.08.2004) map of relative seasonal displacements of ground surface was constructed. For used interferometric pair temporal baseline is the minimum possible period between repeated passes for ENVISAT\ASAR (35 days). Perpendicular spatial baseline is 65m that does not require precise reference digital elevation model (DEM) and so Global TOPO 30 DEM was used for reducing of topography component of the interferometric phase. For the territory covered by ENVISAT\ASAR scenes Global TOPO 30 data does not contain any artifacts such as lines of edges between neighbor sheets of topographic maps.
On the figure 12 map of relative seasonal displacements of ground surface of Fedorov oil field based on interferometric processing of ENVISAT\ASAR frames is showed. Areas of maximum subsidence’s and raisings are selected by color. It is established that negative displacements are connected with discharge of bog in a river network and positive displacements are connected with raising of level of subsoil water in peat bogs in the field of internal drain and anthropogenic sites. An abundance of water observed on LANDSAT-7\ETM (fig. 12b) optical image indicates drainless areas on peat bogs.
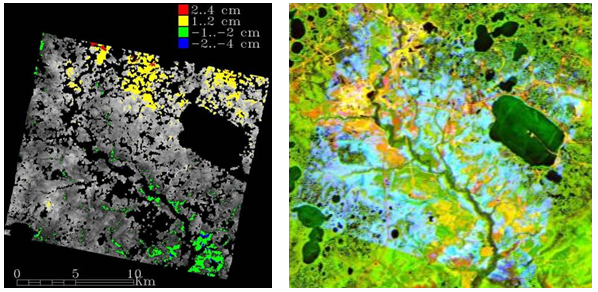
Figure 12. Seasonal displacements on Fedorov oil field a) result of InSAR processing of ENVISAT\ASAR (10.07.2004-14.08.2004) b) LANDSAT-7\ETM optical image (02.06.2001) with the overlapped map of coherence.
In spring, summer and autumn season level of peat bogs presented on territory of West Siberia region is changed; as a consequence displacement of reflective surface is happened. In case of long-term deformations monitoring such seasonal movements have masking effect and does not allow to detect small vertical shifts caused by oil extraction. Displacements on peat bogs caused by water level interseasonal fluctuations were confirmed during the ground investigations in October, 2007. It is well appreciable in field photos of an oil spill (figure 13). Comparison of calculated displacements with the scheme of dynamically stress zones constructed by science center “Geoecologiya” (Surgut) on a basis of lineament analysis using optical satellite images is carried out. Such short-period displacements make negative impact on oil and gas pipelines and raise their breakdown susceptibility. The raised breakdown susceptibility of oil field pipelines in places of crossing with dynamically stress zones can be connected with the seasonal displacements of ground surface which have been detected by the radar interferometric method.
Seasonal displacements of ground surface also are allocated as a result of interferometric processing of PALSAR radar data with temporal baseline of 46 days. Interferometric pair of radar frames with about 300m perpendicular spatial baseline was processed. In this case 3-pass differential interferometric processing with use of reference DEM based on PALSAR data was made.
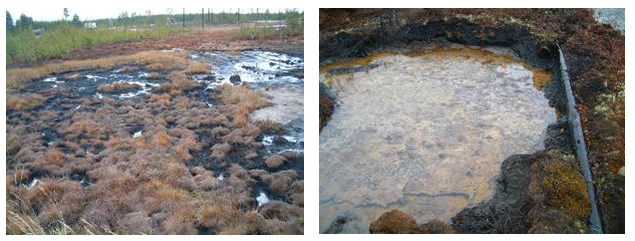
Figure 13. Seasonal changes of surface water level on oil spill areas with defective pipeline at Fedorov oil field. Sub-satellite ALOS observing on October 2007.
As a result of differential interferometric processing of PALSAR data mapping of seasonal displacements on surface of peat bogs was done. Positive and negative shifts up to 4cm for 46 days were fixed. It is established that negative displacements are connected with discharge of bog in a river network and positive displacements are connected with raising of level of subsoil water in peat bogs in the field of internal drain and anthropogenic sites.
Combined analysis of PALSAR and LANDSAT-7/ETM optical images was carried out. An abundance of water observed on optical image indicates dryness areas on peat bogs. Displacements on peat bogs caused by water level interseasonal fluctuations were confirmed during the ground investigations in October, 2007. It is well appreciable in photos of oil spills appeared after pipeline damage.
Application of corner reflectors and technogenic objects for geocoding of SAR images
Ground reference points setting conformity between a pixel on radar image in azimuth and slant range coordinates and a reflective object on ground surface in geographic projection coordinates are applied to increase accuracy of geocoding. For territory of the city of Khanty-Mansiysk which one was the test site during research work checkout of capability of detection of the trihedral corner reflector at platform for rotating with edge length 1.25m on PALSAR imagery (figure 14).
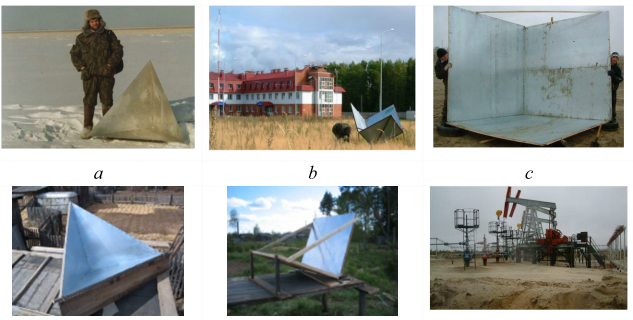
Figure 14. Corner reflector for SAR applications: a) 1m side length on Altai steppe, SRTM 2000 b) 1.25m size installed on site of weather station of Khanty-Mansiysk city c) 2.5m size for PALSAR sub-satellite experiment d)-e) 1m size for ERS-2 sub-satellite experiment f) objects of typical multiple-well platform.
Under condition of a minimal backscattering from background surface such corner reflector is probably to detect on a PALSAR frame.
Placing of enough of corner reflectors with edge length enough for detection on the radar image on the long-lived period in the conditions of an inaccessible terrain is labor-intensive and cost intensive process. The basic problem consists in delivery and installation of corner reflectors to an oil field. Analysis of the amplitude component of radar images received from satellites ERS-2, ENVISAT, ALOS, TerraSAR-X, revealed high backscattering from oil production objects. For oil extraction on territory of license districts the large quantity of multiple-well platforms is disposed.
On each multiple-well platform which one is presented in the figure 15 mining rotary balanced jacks and other concomitant objects are disposed. Each metal object which is located on territory of a multiple-well platform represents industrial and technogenic corner reflector and is dedicated with a bright point on a radar image. Standard electric control unit of rectangular form has higher then background.
For synthetic metal corner reflectors presented in figure 16 level of reflection exceeds background values from 2 to 74 values. Prompting of a receiving antenna TNA-9 (figure 16 up) on ALOS and ERS-2 satellites was carried out during their remote sensing of Khanty-Mansiysk city. Level of reflection of the TNA-9 antenna exceeds background in 200 values.
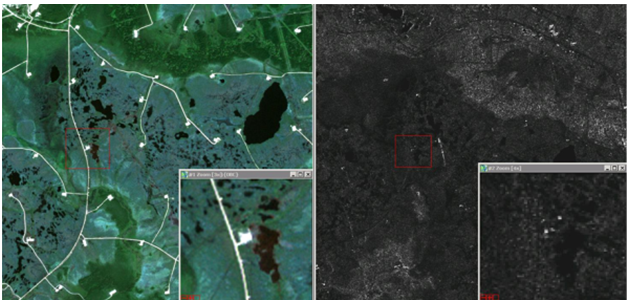
Figure 15. Oil production objects on ALOS images AVNIR2 (17.07.2007) and PALSAR (4.10.2007).
During sub-satellite measurements in terrain of oil and gas fields of KhMAO-Ugra using GPS receiver coordinates of ground control points were determined. These coordinates are used to improve geocoding of PALSAR radar images.
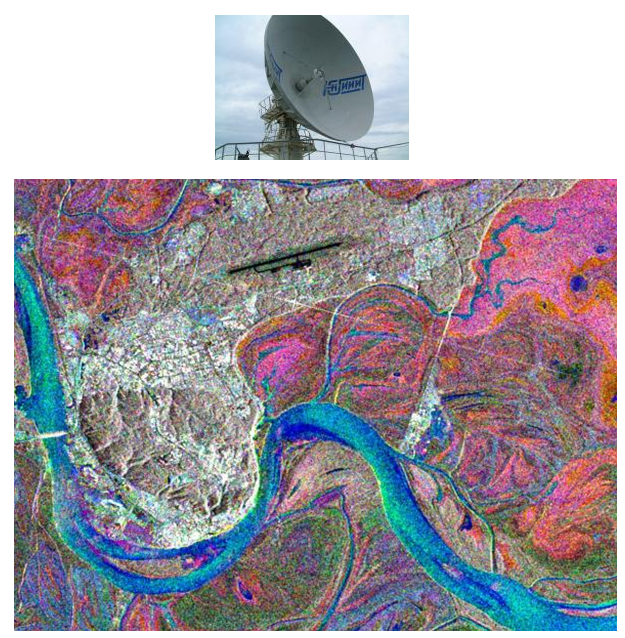
Figure 16. Receiving antenna of TNA-9 and ERS-2\SAR image with a reflection beam from TNA-9 mirror. Color composite dates: R:2006/07/20, G:2005/08/24, B:2005/07/05.
Coherence distribution analysis
Radar interferometry method is based on processing of coherent signals reflected from ground surface at various times. The value of complex correlation (coherence) reflects the degree of interferogram destruction and it is a measure of applicability of pair of radar images for further processing. Decrease of signals coherence is promoted by some factor (sources of decorrelation):
γ =γgeom ×γvol ×γtemporal
where ![]() is the spatial
(geometrical) decorrelation as a result of difference of ground observation
angles during the repeat passes sensing,
is the spatial
(geometrical) decorrelation as a result of difference of ground observation
angles during the repeat passes sensing, ![]() is the
volume decorrelation caused by propagation of radar signals through growth,
is the
volume decorrelation caused by propagation of radar signals through growth, ![]() is the temporal decorrelation due to
changes of reflective properties of objects and their reorientation inside the
resolution element.
is the temporal decorrelation due to
changes of reflective properties of objects and their reorientation inside the
resolution element.
In landscapes of Western Siberia basically marshlands and territories occupied with dense coniferous wood prevail. Interferometric processing of images received by radars with 5.6cm wave length (C-band) does not allow obtaining exact results because of low coherence of signal due to remote sensing from repeated passes. The signal with 5.6cm wave length has low ability at propagation through vegetative covers and so volume and temporal decorrelation are increases. PALSAR sensor installed on ALOS satellite uses L-band sensing signal (23cm) that excludes influence of snow and small vegetation.
However even for PALSAR areas of interferogram with temporal baseline more than one year corresponding to wood territories possess low coherence caused owing to volume and temporal decorrelation. L-band signals reflected from marshland and areas with low vegetation at different time have enough level of coherence (>0.25). Thus coherence remains even if radar image pairs with temporal baseline more than two years are processed. However areas of interferogram with low coherence have considerable noise level. Besides, in a kind of specificity of natural landscapes of the north of Western Siberia, the radar signal is reflected not from a mineral ground, and from surface of peat bogs. Thus change of a vegetative cover reduces coherence of radar signals received at different times.
Coherence of multi-temporal radar signals depends on ground surface reflection power and so this value is non-uniformly distributed across the area of a scene. On the displacements map obtained as a result of interferometric processing considerable area corresponding to forest territory contains incorrect phase values destructed by high temporal decorrelation. Such areas are cut before phase unwrapping step and the threshold value is 0.25.
Owing to non-uniformity of coherence allocation displacements map (2007-2008) for the southeast part of the Samotlor oil field consists of set of small fragments. Such fragments correspond to high level of coherence, but on small-scale charts are identified as noise and do not give any helpful information at the analysis of a subsidence map.
Processing of displacement maps Gubkinsky oil-gas condensate field
The importance of the given work is defined by necessity of decrease breakdown susceptibilities of oil and gas pipelines. At the same time Earth surface displacements monitoring in oil and gas fields areas is regulated by «The Instruction on Surveying Operations. RD-07-603-03» by «Gosgortechnadzor» (Russian State Engineering Supervision Instance). This monitoring must include creation of the fixed reference points system both in limits of hydrocarbon field contour and outside of it (i.e. in the area of possible man-caused deformation and outside of this area). Traditional methods of regular measurements (mostly 2nd class leveling) should be applied on this system of points. Differential radar interferometry is an effective method for estimation of plane and vertical displacements in big areas caused by breakdown structure movements. High cloudiness and snow period duration caused by location of investigated territory in north latitudes make difficulties for monitoring of ground surface by optical remote sensing data.
High rates of development of the Gubkinsky oil-gas condensate field located in the Yamalo-Nenetskiy Autonomous Okrug created an urgent need of an objective assessment of the common condition of the geological environment and technological objects of oil and gas production. For this assessment it is used data of complex monitoring on the geodynamic range within borders of mountain branch where there are main technological and social objects [29, 32].
The Gubkinsky geodynamic range is constructed in 2000-2001. The laying of the centers is executed by a drilling method. Depth of a freezing of soils on a site of works was accepted – 2m. Proceeding from it, depth of a laying of reference points was accepted – 4m.
Key feature of structural model of the Gubkinsky gas field is its tectonic inhomogeneity – a crust-block structure of the geological environment which is displayed on cards and in a configuration of area mould displacement, and also proves to be true the quantitative indices of points of supervision of the geodynamic range. It differently the vector values of horizontal and vertical displacements received by high-precision geodetic measurements. They confirm the nature and "life" of each of blocks, both regarding dynamics of amplitudes of vertical motions, and regarding a differentiated intense and straining condition of subsoil.
Ground measurements on the Gubkin geodynamic polygon were carried out only in 2000 and 2006 there is no additional information for processing. Deformations detected on Gubkin gas field are from -3 cm to +4 cm during 2007-2008 and from -5cm to +7cm during 2007-2009. Tendency of positive and negative displacements of ground surface remain keeps during 3 consecutive cycles of measurements and so validity of deformation detection is confirmed.
Basis of the analysis of geodynamics is the scheme of dynamically intense zones executed on technologies of creation of models of a crust-block structure of oil fields. On the square of Gubkinsky gas field the scheme of lineament is constructed and the lineament analysis is carried out. Zones of crossing of lineament created 42 blocks. Imposing of area of mould displacement on the scheme of blocks allowed receiving displacement area in block option (figure 9). The analysis of the lengthiest axes of blocks revealed their good correlation with orientation of the lengthiest axes of area of displacement that points to participation of intense and straining processes in formation of area mould sedimentation.
For the first time in the studied territory the method of a space radar interferometry is applied to an assessment of deformations of a terrestrial surface from falling of sheeted pressure at the long-lived gas production. This method allows to trace remotely sizes of vertical motions of a terrestrial surface during various time frames – from the minimum period of retakes to several years. For the ALOS satellite the period of repeated flight made 46 days. It gives the chance to divide with a split-hair accuracy participation of natural and technogenic processes in formation mould displacement, and also on the basis of calculation interferometric data’s to show annual change of a form mould sedimentations.
Perfecting of a method of a satellite radar interferometry allows to receive planned estimates of heights to within the first meters and shifts to within the first centimeters. The single restriction which brings the considerable mistake in result of processing, the space and temporary de correlation is that for the territory of Western Siberia is caused by feature of a landscape structure and fast changes of a masking vegetative cover.
Using InSAR technology estimation of displacements on Gubkin gas field was carried out. Geodynamic polygon is also developed on this gas field. However in comparison with the Samotlor geodynamic polygon here ground measurements were not carried out for a long time and so less additional information is enabled for interferometric processing. 8 scenes of PALSAR data covered area of the Gubkin gas field were ordered. Sensing was carried out in Fine Beam Single mode with 5m spatial resolution.
Maps of displacements for 2007-11, constructed by results of interferometric processing of radar-tracking measurements, allowed to designate zero border mould sedimentations (yellow line on figure 17 up-right), formed on the Gubkinsky gas field. Constructed mould displacement, in large part the areas well correlates with features of dynamics of sheeted pressure and it is supposed that mould fields (1999-2011) are to some extent formed as a result of intensive and long-term development.
Vertical and horizontal displacements of a day surface as a result of intensive topping from a collector average 1.7 to 2.3 mm a year when falling sheeted pressure upon one atmosphere that is characteristic for maintained hydro carbonic fields within average duration of development of 9-12 years. The analysis of maps of the taken gas and thickness of lifting of the gas-water contact, constructed on the basis of instrumental land measurements, shows that displacement moulds for 2007-2011 defined by a method of a multi-pass radar interferometry are well correlated with sizes of volume of topping gas and lifting of level of gas-water contact.
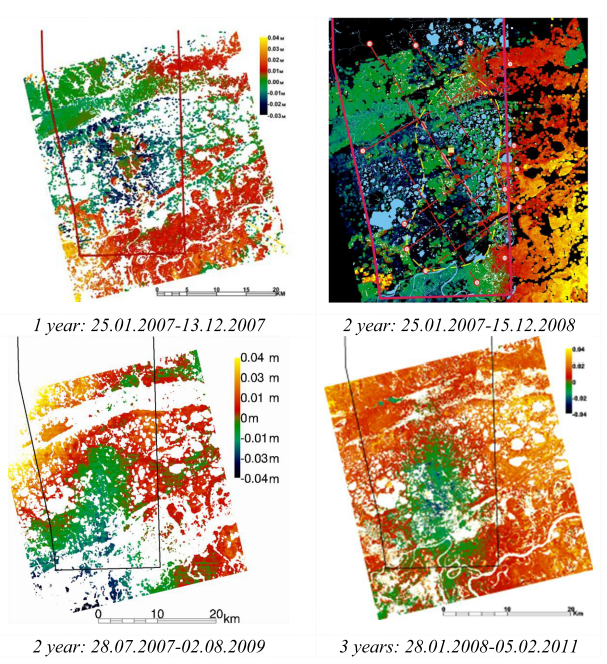
Figure 17. Multi-time monitoring of ground surface displacements at Gubkin gas field using ALOS\PALSAR InSar data.
As a result of interferometric processing reference DEM reflecting ground surface state of the Gubkin gas field were constructed. Displacements computation was carried out with ground control points and so constructed maps reflect relative subsidence of ground surface for the time interval between radar sensing. Areas of negative displacements correlate with points of maximum gas extraction on the Gubkin gas field.
Displacement maps on Samotlor oil field
On the territory of the Samotlor oil field and the geodynamic range long-term monitoring of sags of a terrestrial surface on the basis of ALOS\PALSAR data was carried out. According to the ecological program “Complex system of geodynamic safety in the license area of Samotlor oil field” closed company scientific production association “Center of applied geodynamics” the Samotlor geodynamic polygon has been being developed during 2001-2002 years. Since 2002 yearly in summer season on the geodynamic polygon leveling, GPS-measurements and gravitational survey is carried out. West Siberian Branch of Institute of Petroleum Geology and Geophysics of the Siberian Branch of Russian Academy of Science carries out mining and ecological monitoring of claim of Samotlor oil field [19].
In spite of great amount of deep reference markers (104 monuments) installed on the geodynamic polygon point ground measurements allow to do plane estimation only using additional interpolation. Therefore during 2008-2011 interferometric processing of PALSAR data was carried out in order to construct displacement map of Samotlor oil field.
In previous researches [27-32] results of processing of radar frames on the territory of the Samotlor geodynamic polygon from 2007 till 2008 were discussed and DEM and vertical displacements map were constructed. Displacements map (figure 18) based on InSAR data reflects current geodynamic state of the Samotlor oilfield produced during more than 40 years and is qualitatively adjusted with subsidence mould based on ground geodetic measurements on the geodynamic polygon.
In 2009 the problem of construction of displacements map of Samotlor oilfield and adjoining territory is set to estimate influence of adjacent oilfields on subsidence mould forming. Additional task is improvement of vertical component accuracy. In summer, 2009 the next cycle of geodetic operations on the Samotlor geodynamic polygon points including 2nd grade of accuracy leveling and gravimetric and GPS measurements was carried out. Additionally differential interferometric processing of radar data was made.
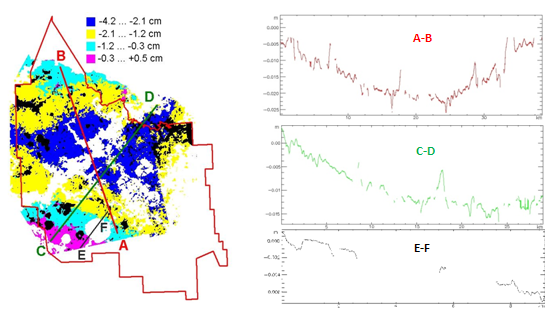
Figure 18. Vertical displacements on Samotlor oil field and transects over subsidence mould. PALSAR processing on 2007 – 2008.
Accuracy of ground surface displacements detection by radar interferometry method depends on coherence of source amplitude-and-phase measurements. Mean error of subsidence map of the Samotlor oilfield is 1cm. Mean error of values outside the Samotlor geodynamic polygon for area without ground control points is 4cm. Joint analysis of displacements map during 2007-2009 shows reduction of subsidence forming the mould.
As materials for interferometric processing 18 scenes of ALOS\PALSAR from two orbits with overlapping data covered Samotlor oilfield and adjacent territory were used (figure 19). As a result of differential interferometric processing 6 displacements maps covering research area were constructed. To obtain absolute values of ground surface displacements height changes fixed on the Samotlor geodynamic polygon points from 2008 till 2009 were used. Negative and positive displacements of Earth crust blocks over the last two years testify validity of detection subsidence by radar interferometry approach. The negative shifts are bound with the fissile subsidence moulds on several oil fields located in this territory, positive are dated for vegetation development.
Thus 3 cycles of interferometric processing of radar data on territory of the Samotlor oil field were carried out. Mean error of displacement values is 2cm. Zero values of isohyps of the subsidence mould based on materials of geodetic monitoring using shifts of reference points of Samotlor geodynamic polygon fixed during 2007-2010 are well correlated with results of differential interferometry. Conjectural zero isohyps of the subsidence mould in area without enough installed ground markers was corrected on the basis of results of PALSAR data processing. Central the most down part of the subsidence mould with displacement values from -10mm to -14mm are well correlated with interferometric measurements. Radar data also allow to make zero isohyps more accurate.
As a result of combination displacements maps and materials of ground measurements interpretation 4 epicenters of negative deformations were detected. Such combination adds assurance in conclusions that subsidence zones are corresponded to anomalous areas of Earth masses concentration.
In 2009 and 2010 the problem of construction of displacements map of Samotlor oilfield and adjoining territory is set to estimate influence of adjacent oilfields on formation of subsidence mould. Additional task is improvement of vertical component accuracy. In summer seasons of 2009 and 2010 next 7th and 8th cycles of geodetic operations on the Samotlor geodynamic polygon points including 2nd grade of accuracy leveling and gravimetric and GPS measurements was carried out. Additionally differential interferometric processing of radar data was made. As materials for interferometric processing 59 scenes of ALOS\PALSAR data covered Samotlor oilfield and adjacent territory were used. As a result of differential interferometric processing 6 displacements maps covering research area were constructed. To obtain absolute values of ground surface displacements height changes fixed on the Samotlor geodynamic polygon points from 2008 till 2009 were used. For territory without geodetic measurements ground control points with zero displacement were used [30].
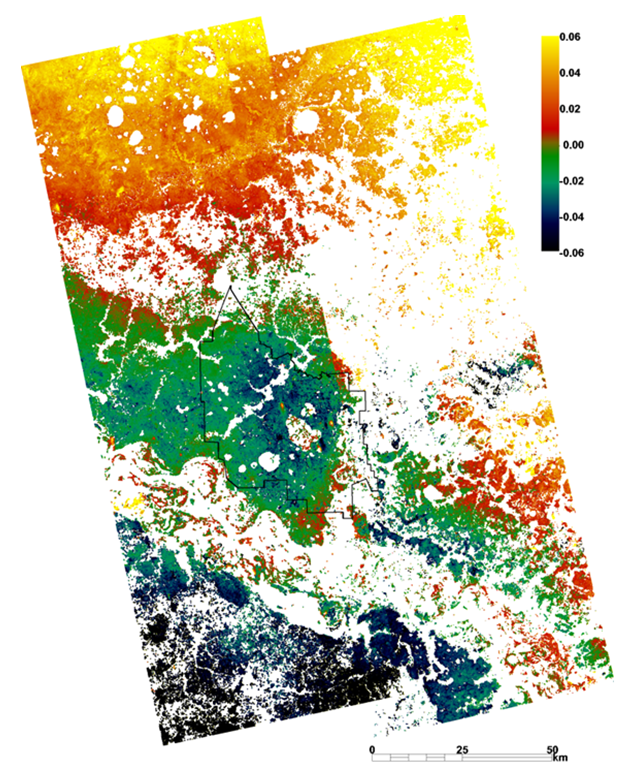
Figure 19. Map of ground surface long-term vertical displacements (m) in area of the Samotlor oilfield 2008-2009.
Application PSInSar for an assessment of velocity of subsidence
Temporal and baseline decorrelation factors and atmospheric inhomogeneities does not allow classic radar interferometry approach to became an effective mathematic instrument for monitoring of ground surface deformations occurred during long-lived period (more than 3 years). Due to temporal decorrelation interferometric measurements for areas with dense vegetation and for sites where electromagnetic properties and-or positions of elementary reflectors inside the resolution cell are changed in time become impossible.
Geometric decorrelation limits quantity of interferometric pairs which can be used in processing. Atmospheric inhomogeneity’s create a phase shift which one is superposed with each radar image and reduces accuracy of displacement estimation. Besides atmospheric phase shift generates slow phase change within a radar scene depending on water vapor distribution and cannot be valued and eliminated on the basis of the coherence map.
Results of interferometric processing can be spatial maps, in case of landscapes, and point wise, in case of technogenic objects. Offset of technogenic objects can be provided in in temporal dynamics in the form of diagrams and graphics. The graphic information on dynamics of offsets, analytical information on detection of points of "burst", the prognostic estimates received on the basis of statistical techniques is provided to the ultimate user.
Persistent Scatterers Interferometry (PSI) approach was developed at Politecnico di Milano in 1999 and is well described in science literature. Advantages of this approach are based on specific properties of point objects that keep high level of the radar signal backscattering during many repeated multi-temporal acquisition.
Often size of such point reflective
object is less than resolution cell therefore coherence is high enough (![]() >0.5) even for pairs of frames with
spatial baseline more then the critical value. In the condition that
atmospheric phase shift was estimated and eliminated heights of persistent
scatterers above the reference surface can be reconstructed with accuracy
better than 1m and displacements precision is better than 1cm.
>0.5) even for pairs of frames with
spatial baseline more then the critical value. In the condition that
atmospheric phase shift was estimated and eliminated heights of persistent
scatterers above the reference surface can be reconstructed with accuracy
better than 1m and displacements precision is better than 1cm.
For monitoring of petroleum objects located on territory of oilfields of Khanty-Mansiysk Autonomous Okrug method of persistent scatterers interferometric processing described at the paper [32] was realized. This approach contains algorithms of master and slaves scenes selection, persistent scatterers detection and calculation of atmospheric phase shift, heights and displacement velocities. Three main moments that were used in this research work are presented below.
PSI approach used ![]() multitemporal radar images of the
observable site of ground surface. One of them is selected as a master and
others
multitemporal radar images of the
observable site of ground surface. One of them is selected as a master and
others ![]() are referenced as slaves and
are referenced as slaves and ![]() interferograms are generated. Selection
of master scene is based on minimization of influence of factors that reduce
interferometric coherence.
interferograms are generated. Selection
of master scene is based on minimization of influence of factors that reduce
interferometric coherence.


where ![]() ,
, ![]() and
and ![]() are
the values of the normal baseline, the temporal baseline and the mean Doppler
centroid frequency difference of each pair of frames;
are
the values of the normal baseline, the temporal baseline and the mean Doppler
centroid frequency difference of each pair of frames; ![]() ,
,
![]() ,
, ![]() are
the critical values of given parameters.
are
the critical values of given parameters.
Initial scene ![]() with maximum value of
with maximum value of ![]() is selected as a master [34].
is selected as a master [34].
The next stage is selection of points which can be persistent scatterers.
An object can be a candidate of persistent scatterer if it has high and stable backscattering level (pixel amplitude), than phase of the radar signal received from such object has low dispersion. Standard approach based on coherence map is useless due to:
- compex interferometric coherence is subjected to influence of spatial baseline variations and reference elevation model errors;
- during coherence map generation averaging of values within moving running window is carried out and so individual points can be lost.
Another approach consists in using the condition of pixel amplitude stability.
where ![]() is the phase
dispersion value;
is the phase
dispersion value; ![]() is the amplitude dispersion
value;
is the amplitude dispersion
value; ![]() is the dispersion index.
is the dispersion index.
For persistent scatterers candidates
selection the threshold value is set to ![]() . The
main condition is that amplitude images should be radiometricaly corrected and
normalized.
. The
main condition is that amplitude images should be radiometricaly corrected and
normalized.
Further processing is carried out for
![]() interferometric pairs and for
interferometric pairs and for ![]() individual pixels represented as
persistent scatterers. Estimation of atmospheric phase shift, heights and
displacement velocities is carried out in accordance with next system of equations.
individual pixels represented as
persistent scatterers. Estimation of atmospheric phase shift, heights and
displacement velocities is carried out in accordance with next system of equations.
![]() (1)
(1)
where
-
![]() are differential
interferometric phase values;
are differential
interferometric phase values;
-
![]() are constant phase values;
are constant phase values;
-
![]() and
and![]() contain
the slope values of the linear phase components, along the azimuth
contain
the slope values of the linear phase components, along the azimuth ![]() and slant range
and slant range ![]() direction
due to atmospheric phase contributions and orbital fringes;
direction
due to atmospheric phase contributions and orbital fringes;
-
![]() contains the normal
baseline values (referred to the master image). For large areas,
contains the normal
baseline values (referred to the master image). For large areas, ![]() cannot be considered constant, and the
array
cannot be considered constant, and the
array ![]() may become a matrix
may become a matrix ![]() ;
;
-
![]() contains phase vales
proportional to the elevation of each persistent scatterer;
contains phase vales
proportional to the elevation of each persistent scatterer;
-
![]() contains the time
interval between
contains the time
interval between ![]() slave images and the master
one;
slave images and the master
one;
-
![]() contains slant range
velocities of the persistent scatterers;
contains slant range
velocities of the persistent scatterers;
-
![]() contains residues that
include atmospheric effects different from constant and linear components in
azimuth and slant range direction, phase noise due to temporal and spatial
decorrelation, and the effects of possible random pixel motion.
contains residues that
include atmospheric effects different from constant and linear components in
azimuth and slant range direction, phase noise due to temporal and spatial
decorrelation, and the effects of possible random pixel motion.
As formulated in (1), the problem
would be linear if the unwrapped values of matrix phase ![]() were
available. We have
were
available. We have ![]() equations and
equations and ![]() unknowns:
unknowns: ![]() ,
, ![]() ,
, ![]() ,
, ![]() ,
, ![]() . Data
are
. Data
are![]() ,
, ![]() ,
, ![]() ,
, ![]() ,
, ![]() . Thus, in principle, (1) could be
inverted to get the local topography, the velocity field, and constant and
linear phase contributions. In practice, however, we face a nonlinear system of
equations (phase values are wrapped modulo
. Thus, in principle, (1) could be
inverted to get the local topography, the velocity field, and constant and
linear phase contributions. In practice, however, we face a nonlinear system of
equations (phase values are wrapped modulo![]() ) to be
solved by means of an iterative algorithm, and an available digital elevation
model should be exploited to initialize the iterations. Reference digital
elevation model is used for interferogram flattening and reducing known
topography.
) to be
solved by means of an iterative algorithm, and an available digital elevation
model should be exploited to initialize the iterations. Reference digital
elevation model is used for interferogram flattening and reducing known
topography.
The nonlinear system of equations (1) can be solved provided that:
1) the signal to noise ratio is high enough (i.e., the ![]() selected pixels are only slightly affected by decorrelation
noise);
selected pixels are only slightly affected by decorrelation
noise);
2) the constant velocity model for target motion is valid;
3) the atmospheric phase shift distribution over the research area can be approximated as a phase ramp.
The convergence depends on the following factors:
1) space-time distribution of the acquisitions (which should be as uniform as possible: spatial and/or temporal “holes” in the data set should be avoided);
2) reference digital elevation model accuracy (![]() should generate small phase contributions
for low
should generate small phase contributions
for low ![]() );
);
3) dimensions of the area of interest (atmospheric phase shift distribution and orbital fringes should be well approximated by linear phase components);
4) target motion should be slow enough to avoid aliasing and
be well approximated by the constant velocity model. For convergence, ![]() should generate small phase contributions
for low
should generate small phase contributions
for low ![]() .
.
Accumulation of sufficient volume of retakes of radar ALOS\PALSAR which is successfully functioning in an orbit in 2006-2011 allowed to apply the PSI method on the oil production region with a large number of punctual technogenic objects. Examples of successful multi-temporary monitoring of sags of a terrestrial surface are known by the fissile technogenic development on the considerable depths for a method of a radar interferometry.
Displacements velocities were computed using developed “PSIVelocityComp” software [32] based on classic PSInSAR approach described by A.Ferretti [25]. Negative displacements computed by radar data processing were also confirmed by ground geodetic measurements including GPS and leveling. On territory of the power station industrial monitoring on basis of 300 bench marks is carried out yearly.
PSInSar of computation long on time for 6-8 scenes of ASAR and PALSAR are executed in environment of MatLab on distributed cluster from four 8 kernel personal computers with memory 12Gb. Maximum number of points of calculation makes from 200 to 500 (figure 20).
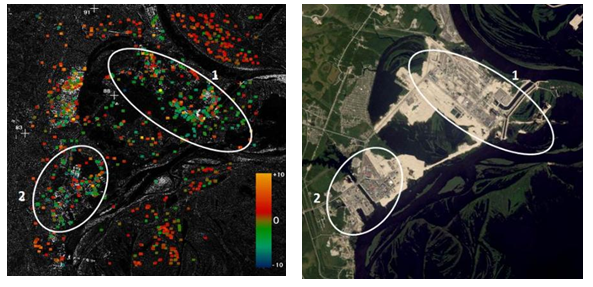
Figure 20. Relative velocities of displacements (mm per year) calculated by PSInSar on 2006-2010. a – displacements velocities, b – AVNIR2 optical image (17.07.2007). 1 – Izluchinsk State District Power Station; 2 – Izluchinsk settlement.
Result of PSInSar of computation is file containing information on the relative offsets in points. The software of representation of results is developed for organization of multi-user access to results in online mode with use of GeoServer and Google Maps technologies (figures 21-22). The spatial target data for publication in GeoServer is stored in database PostgreSQL.
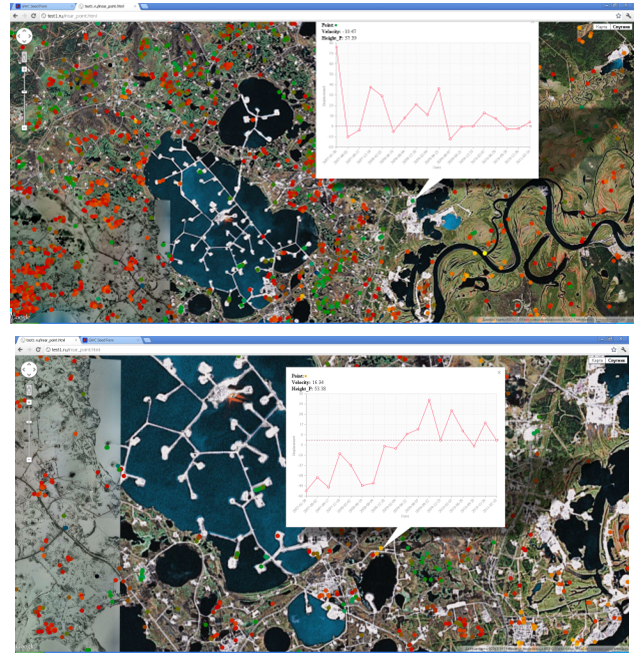
Figure 21. Absolute displacement time series and velocity calculated by Persistent Scatterers Interferometry on 2006-2011on Samotlor oil field.
Also larger calculations are carried out in the environment of MatLab on a cluster of 128 DELL Power Edge M600 Servers with peak performance 12 Tflops, random access memory 4 Tb and 256 Quad-core processors. As a client node has performed a personal workstation. Managing site was placed on the control node of the cluster. For data used internal network resource cluster. This configuration of the computer system allows for the preparation of design data in streaming mode, which improves system performance by minimizing downtime. On each compute node holds six of computational processes. The total number of computing processes was 132.
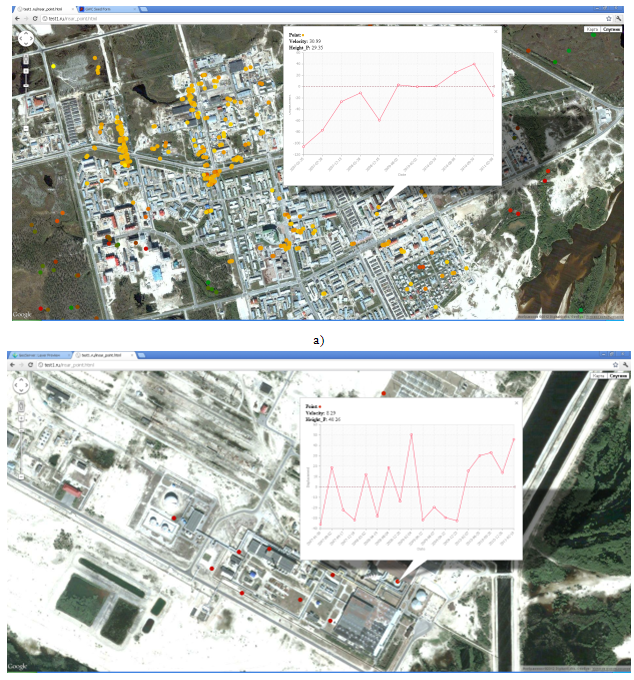
Figure 22. Absolute displacement time series and velocity calculated by
Persistent Scatterers Interferometry on 2006-2011: a) Gubkin city b) Izluchinsk
State District power station.
The number of reflecting points of calculation makes from 5000 to 40000 for 15-30 scenes of SAR, ASAR and PALSAR. Computations are executed in supercomputer of Research Institute of Applied Informatics and Mathematical Geophysics of Immanuel Kant Baltic Federal University.
Main results use DInSar PSInSar technique for surface subsidence
Thus, for 2007-2011 four cycles of interferometric processing of radar data on territory of the Samotlor oil field and the Gubkin gas field have been carried out. Trend of negative and positive displacements of Earth crust blocks over the last two years testify to validity of detection subsidence by radar interferometry method.
On basis of interferometric processing results following conclusion can be made:
1. Displacements map displays subsidence of envelope of surface reflecting radar signal and so detected displacements prone to masking influence of natural growth. For areas with low vegetation which is transparent for L-band sensing signal computed displacements correspond to the Earth crust blocks. Using of radar sensing results of the same months of different years minimizes influence of seasonal changes of peat bogs level.
2. To increase accuracy of displacements detection using of persistent scatterer interferometry is recommended. This method will enable to measure subsidence of separate petroleum objects. Method of interferogram processing based on radar interferometry stochastic model and using complex multi-looking to reduce uncorrelated noise was developed. The approach enables to compute absolute phase for areas with low coherence and to measure ground surface height with precision up to 5m and displacements with precision up to 2cm.
3. Using introduced method of processing of interferogram noisy due to high temporal decorrelation reference Digital Elevation Models were constructed. Reference DEMs were used in order to detect seasonal displacements on wide areas. It was able to ascertain that negative displacements are associated with peat bogs discharge into river network. Positive displacements are connected with lifting of water level in peat bogs in areas without drainage and technogenic regions (oil extraction objects).
4. Developed methods are used during research geo-ecological monitoring on territory of oil and gas fields. Displacements maps based on radar data interferometric processing make it possible to precise and correct borders of subsidence mould obtained during geodetic measurements. The complex of the researches spent using remote sensing data is addition to the land geological and geophysical works which are carried out by oil-extracting companies.
5. New method of interferometric phase filtering was realized and checked during DEM and displacements map computing on territory of West Siberia.
6. Method of estimation of precision of DEMs and displacements map using topographic maps and precision measurements on geodynamic polygons.
7. Degree of exceeding a back reflection level over background area was experimentally detected on amplitude X-, C- and L- band SAR images. Method of radar frames geocoding based on using of bright points of oil extraction objects appearing as an artificial corner reflector.
8. Optimal conditions of radar sensing in order to compute interferogram minimally destructed by temporal decorrelation are established:
- for C-band (5.6cm) SAR images to compute informative interferogram preferable sensing season is late autumn and summer, when the least changes in plant cover structure is occurred;
- for West Siberian region with predominant wetlands and forests L-band (23cm) SAR images are preferable for interferometric processing rather than C and X band (3cm).
9. On basis of developed method of preliminary analysis of radar data batch processing of large archives of ENVISAT\ASAR, ERS-2\SAR, ALOS\PALSAR images was realized in order to compute coherence maps and further visual analysis and selection of interferometric pair good for DEM construction and displacements detection.
10. Subsidence maps on territory of intensive oil and gas extraction in Ugra and Yamal regions. Interferometric pairs with temporal baseline up to 3 years were used. Considering seasonal displacements ground surface subsidence caused by oil extraction were detected. Using displacements values measured by means of high precise methods (GPS-measurements and leveling) on points of geodynamic polygons it is possible to construct absolute displacements map. Joint analysis of spatial profiles and displacements maps on territory of Samotlor and Gubkin deposits shows decreasing of subsidence forming the trough.
11. Using persistent scatterers interferometry approach displacements velocities of technogenic objects on territory of Izluchinsk power station as an area of geodynamic risk.
12. The development of methods and technologies InSar subsidence monitoring will be continued with the launch of new radar satellite ALOS-2, SENTINEL-1, KONDOR-E [33-35].
Conclusions Remarks
Results of the given research work were discussed at scientific-technical meetings at TNK-BP SamotlorNefteGaz and also at scientific conferences in Russia and Europe. The authors expresses his thanks to Ugra Research Institute of Information Technologies for assigned equipment and computational resources, to West Siberian Branch of Institute of Petroleum Geology and Geophysics of the Siberian Branch of Russian Academy of Science for additional materials, to TNK-BP SamotlorNefteGaz for approbation and critical remarks about results of interferometric processing.
The research work is supported by projects European Space Agency:
ESA ENVISAT-AO ID 365 «Environmental pollution monitoring over the oil and gas exploitation regions (northern parts of Russia) using ENVISAT data»;
ESA Category-1 ID 3166 «InSAR application for monitoring of ground displacement in areas of an intensive oil recovery in Western Siberia»;
ESA Category-1 ID 3162 «Establishing the system of the near- real time space monitoring of changes in the buffer zone of pipelines with ERS-2 SAR use»;
ESA Category-1 ID 3110 «All-weather detection of forest fires and their consequences in Northern Siberia»;
ESA Category-1 ID 3159 «Environmental pollution monitoring of the oil production regions using ERS-2 data»;
ESA Category-1 ID 3161 «Application of remote sensing and GIS for flood monitoring in Western Siberia»;
ESA Category-1 C1P.9359 ENVISAT «Radar interferometry for oil fields study»;
and Japan Aerospace Exploration Agency:
NASDA No. J-2RI-026 «Understanding JERS-1 wave scattering mechanisms and factors in remote sensing of the Siberian forests»;
JAXA/07/ASP No. 0704001 «Detection of earth surface displacements in area of intensive oil production by radar interferometry»;
JAXA/09/AEO № 0223001 «Study of topography and geology of the Baikal region using optical and radar ALOS data».
Work is carried out with support of the Russian federal target program «Researches and development in the priority directions of development of a scientific and technological complex of Russia for 2007-2013», project 2011-1.4-514-036-004 «Development of a program methodological support of a high-precision assessment of shifts of technogenic objects on the basis of a method of interferometric processing of satellite radar data».
References
1. Mironov V.L., Komarov S.A., Yevtyushkin A.V. and Romanov A.N. Remote sensing in the problems of regional ecological monitoring of land covers // Technological Civilization Impact on the Environment. International Symposium INTAS. Abstracts. Karlsruhe, Deutschland. 1996. p. 90.
2. Baikalova T.V., Dubina I.N., Yevtyushkin A.V., Zhilin S.I., Oskorbin N.M., Polyakov Yu.A., Yushakov V.N. Automation of digital mapping in systems of regional ecological monitoring // Proceedings of the International Conference «INTERCARTO-2: GIS for Environmental Studies and Mapping». Irkutsk. Russia. 1996. pp. 67-71.
3. Alekseev A.S., Yevtyushkin A.V., Kalantaev P.A., Mironov V.L., Oskorbin N.M., Pyatkin V.P., Yushakov V.N. Digital cartographical support of applied remote research // Proceedings of the international conference « INTERCARTO-3: GIS for Environmentally Sustainable Development». Novosibirsk. Russia. 1997. pp. 231-239.
4. Evtyushkin A.V., Komarov S.A., Luk'yanenko D.N., Mironov V.L. Classification of the Earth's cover by radar images // Atmospheric and Oceanic Optics. 1997. V. 10. 12. pp. 1508-1512. (in Russian with English abstract).
5. Baikalova T.V., Kazantsev K.V., Komarov S.A., Lukyanenko D.N. Mironov V.L., Yevtyushkin A.V., Yushakov V.N. // Analysis of forest regions by SAR and optical images. Proceedings of Geoscience and Remote Sensing Symposium (IGARSS’98). Seattle, USA. 1998. Vol. 3. pp. 1723-1725.
6. Komarov S.A., Mironov V.L., Romanov A.N., Yevtyushkin A.V. Research on the Earth cover remote sensing problem carried out at the Altai state university // Proceedings of Geoscience and Remote Sensing Symposium (IGARSS’98). Seattle. USA. 1998. Vol. 2. pp. 873-875.
7. Komarov S.A., Lukyanenko D.N., Yevtyushkin A.V. Use textural features for decoding of forest regions by SAR images // Proceedings of SPIE. 1999. Vol. 3983. pp. 200-205.
8. Baikalova T.V., Yevtyushkin A.V., Rychkova N.V. Application of the multi-temporary radar and optical space images for detection of traces of catastrophic water flows Biya-Katun // The News of Altai State University. 2002. 1. pp. 57-62. (in Russian with English abstract).
9. Baikalova T.V., Yevtyushkin A.V. Decoding moraine complexes of plateau Ukok on space radar and scanner images with use of three-dimensional digital model of relief // The News of Altai State University. 2002. 3. pp. 72-76. (in Russian with English abstract).
10. Mironov V.L., Komarov S.A., Romanov A.N., Yevtyushkin A.V. Remote sensing of filtration and inundation processes using microwave radiometry // Proceeding of 1993 International Symposium on Radio propagation, Cie Radio Propagation Society – «ISRP'93». 1993. Beijing. pp. 618-621.
11. Komarov S. A., Mironov V. L., Romanov A. N., Yevtyushkin A. V. Remote Sensing of the Water Table: Measurement and a Data Processing Algorithm // Mapping Sciences and Remote Sensing. 1999. V.36. 1. pp. 1-10.
12. Komarov S.A., Mironov V.L., Romanov A.N. Evtyushkin A.V. Remote sensing of groundwater levels: Measurements and data processing algorithms // Earth Observation and remote sensing. 2001. 16(4). pp. 635-646.
13. Baikalova T.V., Komarov S.A., Yevtyushkin A.V., Yushakov V.N. Space Ecology of Altai // CD-ROM. Electronic publisher center of Altai State University. Barnaul. 2000. Informregistr state registration №0320000127. Online -http://www.math.asu.ru/ipl/sea/index.htm
14. Yevtyuskin A.V., Yushakov V.N., Rychkova N.V. Using of remote sensing data for recognition of grain cultures and correction models of bioefficiency // The News of Altai State University. 2002. 1. pp. 63-67. (in Russian with English abstract).
15. Bryksin V.M., Kochergin G.A., Yevtyushkin A.V., Rychkova N.V. Monitoring of grain crops in the south of Western Siberia according to MODIS and ERS-2 space images // Actual problems in remote sensing of the Earth from space. 2007. V.4. No 2. pp. 183-188. (in Russian).
16. Kirbizhekova I. I., Chimitdorzhiev T. V., Tubanov T. A., Tat’kov G. I., Zakharov A. I., Bykov M. E., Dmitriev A. V., Filatov A. V., Evtyushkin A. V. The Results of Lake Baikal Ice Cover Dynamics Research by Methods of Alos Palsar Satellite Radar-Location and GPS-Navigation // Vestnik BSC SB RAS. 2012. 1(5). pp. 42-59. (in Russian with English abstract).
17. Bryksina N.A., Yevtyushkin A.V., Polishchuk Yu.M. Study of dynamics of thermokarst relief forms using space images // Actual problems in remote sensing of the Earth from space. 2007. V.4. No 2. pp. 123-128. (in Russian).
18. Bryksin V.M., Yevtyushkin A.V., Filatov A.V. Technology of creation complex bank of Earth space images // The News of Altai State University. 2011. 1-1(69). pp. 55-59. (in Russian with English abstract)
19. Gribanov K.G., Imasu R., Toptygin A.Y., Bleuten W., Naumov A.V., Yevtyushkin A.V., Dyukarev E.A. and Zakharov V.I. CH4 in the atmosphere over the peat land ecosystem of West Siberia retrieved from AIRS/AQUA spectra // Abstracts 11th Symposium on Integrated Observing and Assimilation Systems for the Atmosphere, Oceans, and Land Surface (IOAS-AOLS). USA, San Antonio, TX, 14-18 January 2007.
20. Evtyushkin A.V. Space monitoring of Khanty-Mansiysk Autonomus Okrug – Yugra Territory. Enviro-RISKS: Man-induced Environmental Risks: Monitoring, Management and Remediation of Manmade Changes in Siberia. Fist-Year EC 6FP CA Enviro-RISKS Project Report: Overview and Progress Reports by Partners. Copenhagen. 2007. pp. 69-72.
21. Bryksin V.M., Yeremeev A.V., Yevtyushkin A.V. Monitoring regional oil pipelines in Western Siberia by optical and SAR space images // Abstracts of International Conference «ENVIROMIS-2006: On environmental observation, modeling and informational systems». Tomsk, Russia. 2006. p. 28.
22. Mironov V.L., Komarov S.A., Evtyushkin A.V., Rychkova N.V. Integrated experiment to soil moisture content in the Altai test area // Earth Observation and remote sensing. 2000. 16(2). pp. 301-312.
23. European Space Agency. ERS-2 SAR Acquisition Plan. 2011. http://earth.eo.esa.int/sarplan/
24. Ferretti A., Monti-Guarnieri A., Prati C. InSAR Principles: Guidelines for SAR Interferometry Processing and Interpretation. 2007. ESA Publications. Noordwijk. 234 p.
25. Ferretti A., Prati C., Rocca F. Permanent scatterers in SAR interferometry // IEEE Transactions on Geoscience and Remote Sensing. 2001. V. 39. Is. 1. pp. 8-20.
26. Kampes B.M. Radar Interferometry: Persistent Scatterer Technique. Springer, Dordrecht, 2006. 212p.
27. Yevtyushkin A.V., Filatov A.V. Application of radar interferometry for digital elevation model constructing and estimation of earth surface displacements // Scientific and technical newsletter of the St.-Petersburg state polytechnic university. 2008. 6. pp. 28-33. (in Russian with English abstract).
28. Filatov A.V., Yevtyushkin A.V. Estimation of Earth surface displacements in area of intensive oil production in Western Siberia by SAR interferometry using ENVISAT\ASAR and ALOS\PALSAR data // Actual problems in remote sensing of the Earth from space. 2009. V.6. No 2. pp. 46-53. (in Russian with English abstract).
29. Vasiliev Yu.V., Yevtyushkin A.V., Martynov O.S., Radchenko A.V., Filatov A.V. Use PALSAR images by geodynamics monitoring gas and oil fields // Actual problems in remote sensing of the Earth from space. 2010. V.7. No 2. pp. 122-128. (in Russian with English abstract).
30. Filatov A., Yevtyushkin A. Detection of ground surface displacements in area of intensive oil and gas production by InSAR data // Proceedings of the ESA Living Planet Symposium. Bergen. Norway. ESA SP-686. December 2010. CD-Publication. European Space Agency. ESA Communications. ESTEC, Noordwijk, The Netherlands. 6 p.
31. Filatov A., Yevtyushkin A. Geodynamic monitoring of oil-and-gas fields using radar Interferometric data // Abstract of 8th International Workshop on «Advances in the Science and Applications of SAR Interferometry» (FRINGE2011). ESA-ESRIN. Frascati. Italy. 2011. pp. 211-212.
32. Filatov A.V., Yevtyushkin A.V., Vasiliev Yu.V. Detection of deformations of industrial objects on territory of oil deposits by radar interferometry // Actual problems in remote sensing of the Earth from space. 2011. V.8. No 2. pp. 157-165. (in Russian with English abstract).
33. Neronsky L. B. Prospects for the development of methods and systems for space-based radar surveillance // Journal of radio electronics. 2011. 11. 23 p. (in Russian with English abstract).
34. Verba V.S., Neronskiy L.B., Osipov I.G., Turuk V.E. Space-borne Earth Surveillance Radar Systems. Edited by Prof. V.S. Verba. M.: Radiotechnika, 2010. 680 p. (in Russian with English abstract).
35. Armand N.A., Zakharov A.I., Zakharova L.N. Spaceborne SAR Systems for Earth Remote Sensing: Modern Instruments and Prospective Projects // Earth Observation from Space. 2010. 2. pp. 3-13. (in Russian with English abstract).