We created an innovated opto-electronic system where integrated-optical sensor, photodetectors, microelectronic comparison scheme, analog-to-digital converter and computer are integrated with the aim to achieve a high sensitivity. The test of this system demonstrates that this sensor can detect the ammonia with the concentration 4 ppm for a signal-to-noise-ratio about 15.
1. Introduction
The detection of gases as CO, NOx, NH3, SOx, O3 is an important task in the different areas: environmental monitoring, physical ecology, medicine, chemistry, defense and citizens protection. There are different types of sensors. Their functioning principles are based on certain physical and chemical effects. Sensors permit to determine various parameters: location, temperature, pressure, humidity, gas concentration, fingerprint, and others [1-5]. Physical ecology, in particular, necessitates the development of sensors that enable one to determine various environmental parameters: temperature, pressure, humidity, and gas concentration.
The progress in physical ecology and environmental monitoring in our opinion is closely related to the development of new type sensors – optical sensors. The interest in the development and application of optical chemical sensors is related to their advantages: high sensitivity, fast response, simplicity of signal multiplexing, and application of integrated technologies [1, 6, 7]. Integrated-optical chemical sensors are in our opinion the most promising among them [1, 6].
The working principle of integrated-optical chemical sensors is based on the variation in the laser radiation intensity transmitted by the gaseous or liquid substance under study, located in a neighborhood of an integrated-optical sensor, at certain wavelengths characteristic for these substances. The main innovation scientific and engineering task is to elaborate an easy-to-use, compact, accurate, and reliable sensor with fast time of the signal response for measuring the atmospheric concentrations of various substances, including ultra low concentrations.
We demonstrate in this paper an innovated opto-electronic system where integrated-optical sensor, photodetectors, microelectronic comparison scheme, analog-to-digital converter and computer are incorporated for deriving high sensitivity. In our opinion this kind of arrangement is a promising trend in the development of the optical sensors for different high-tech applications. One of these applications can be an optoelectronics system of the climate control, where this sensor detect gas concentration and then a computer send commands to the execution devices, which manage a composition of the air in a locality.
2. Elaboration and testing of an opto-electronic scheme with built-in integrated-optical waveguide chemical sensor cell
Figure
1 demonstrates the elaborated opto-electronic system. A helium-neon laser 1
serves as the radiation source. The laser incident beam is split into a
reference and a sensor beams by the half-transparent mirror 2. Sensor beam is input
into integrated-optical waveguide at an angle that corresponds to the resonant
excitation of TE0-mode. The integrated-optical sensor cell 3 is a
diffusion planar waveguide that fabricated by doped PbO2 into
plate glass substrate. The cell length i.e. the distance between the input and
output prisms is 4
cm. The coupling
prisms are made of the TF-5 glass with refractive index of 1.7497 (for
wavelength ![]() =
632.8 nm).
=
632.8 nm).
Fig. 1. Scheme of the elaborated opto-electronic system with integrated-optical sensor cell.
The
attenuation of the used waveguide is equal to 0.1 cm-1 for
fundamental TE-mode with effective refractive index ![]() = 1.521. We used
ammonia (NH3) for the tests, because it is one of the
significantly important gases for the people protection in the different
applications. Note that in the microelectronic industry ammonia is produced,
for example, in the photolithographic technological process.
= 1.521. We used
ammonia (NH3) for the tests, because it is one of the
significantly important gases for the people protection in the different
applications. Note that in the microelectronic industry ammonia is produced,
for example, in the photolithographic technological process.
The radiation is output from the waveguide with an output prism and is measured with first photodetector (PD 1), whose signal is fed to comparison electronic scheme 4. The signal of the reference beam, which is measured with second photodetector (PD 2), is also fed to comparison microelectronic scheme 4. The signal after the analog-to-digital conversion is recorded and processed with a computer 5. The microelectronic comparison scheme 4 is created with use of precision operational amplifiers with small voltage of a displacement and high amplification factor of voltage (the amplifiers have an interior frequency correction and have a good combination of parameters of entering voltages and a noise current). In experiment is established, that this microelectronic scheme is sufficiently stable to the mechanical and other noises. In this new experimental setup the data in opposition to our previous [6] measurement scheme are registering and processing by the computer that permits e.g. rapidly obtain different parameters characterizing experiments.
In accordance with the Bouguer-Lambert-Beer law, we have
where ![]() is the
radiation power at the exit of the cell in the absence of ammonia;
is the
radiation power at the exit of the cell in the absence of ammonia; ![]() is the output
power in the presence of ammonia;
is the output
power in the presence of ammonia; ![]() is the thickness of the layer of the
medium under study, which corresponds to the length of the absorbing cell;
is the thickness of the layer of the
medium under study, which corresponds to the length of the absorbing cell; ![]() is the
absorption cross-section of the substance under study (ammonia); and
is the
absorption cross-section of the substance under study (ammonia); and ![]() is the
measured concentration. We take the ammonia absorption cross-section at the He-Ne
laser wavelength (
is the
measured concentration. We take the ammonia absorption cross-section at the He-Ne
laser wavelength (![]() ≈ 0.63 µm)
≈ 0.63 µm) ![]() ≈ 3.8∙10–16
cm2 [6].
≈ 3.8∙10–16
cm2 [6].
It
follows from formula Eq. (1) that the ammonia concentration ![]() measured in the experiment
is
measured in the experiment
is

Using
the measured data (on can see in the Figure 2: when ammonia is delivered to the
sensor cell, the output laser light power decreases) we have obtained from equation Eq. (2) the experimental ammonia concentration: ![]() ≈ 4 ppm.
≈ 4 ppm.
Now
we can find the ammonia concentration measured at the limiting sensitivity of
the waveguide sensor cell as follows

where ![]() is the noise
power measured at the exit of the cell in the absence of ammonia for a long
realization. Using this expression Eq. (3) we obtained
is the noise
power measured at the exit of the cell in the absence of ammonia for a long
realization. Using this expression Eq. (3) we obtained ![]() ≈ 0.1 ppm for the
maximum experimental signal-to-noise ratio ≈ 20.
≈ 0.1 ppm for the
maximum experimental signal-to-noise ratio ≈ 20.
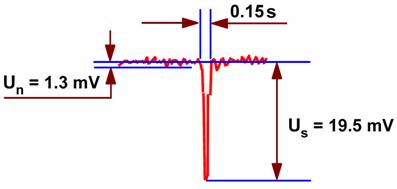
Fig. 2. Example of the sensor response to the presence of ammonia.
In the Fig.3 a fragment of the repeatability test of this sensor system to the relatively identical concentrations of ammonia is depicted. The virtual laboratory “PC-Lab 2000” as a recorder was applied in this test. One can see that elaborated opto-electronic scheme with built-in integrated-optical waveguide cell is adequately sensitive and has enough stable reproducibility of the results (the arithmetic mean deviation of voltage at the moment of ammonia detecting from the average arithmetical value did not surpass 5%).
The experimental
value of the ammonia concentration measured with this
sensor is about 4 ppm. The time response of the computerized integrated-optical
sensor is 0.15 s. The signal-to-noise ratio is about 15. Elaborated integrating
opto-electronic system exhibits in experiments sensitivity, accuracy,
reproducibility of the results, fast response, and a relatively high
signal-to-noise ratio.
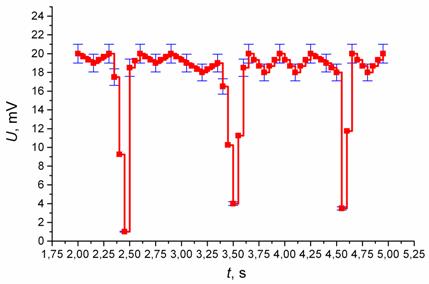
Fig. 3. Repeatability test of the sensor to the rather identical concentrations of ammonia.
We do not analyze in the present paper the effect of the waveguide light scattering due to the waveguide irregularities, since this problem is discussed in detail in different books and journals (see for example [7-11]).
The following approaches can be used to increase the sensitivity of the integrated-optical sensor [1, 2, 6, 7]:
– increase in the length of the absorbing cell;
– modification of the configuration of the absorbing cells (application of the Bragg mirrors or a substrate that represents a cylindrical rod) ;
– increase in the signal-to-noise ratio (by using for example waveguides with low roughness substrates);
– integration of the sensor elements (including: radiation source, absorbing cell, photodetectors, comparison microelectronic scheme, and microprocessor) at a single substrate;
– and others.
3. Conclusions
In this paper we describe an opto-electronic system elaborated with the aim to achieve high stable and sensitive characteristics of the built-in integrated-optical waveguide chemical sensor. As a result the sensitivity of this sensor is increased and time of the signal response is decreased appropriately. The limiting theoretic concentration of these sensors is less 0.1 ppm for the signal-to-noise-ratio more than 20.
In our view, one can use these sensors in the study of both gaseous pollutants and substances dissolved in liquids (e.g., in biomedical, physicochemical, and ecological measurements).
References
1. Chekhlova T.K., Timakin A.G. and Popov K.A. Waveguide sensors for measuring concentrations of components in gas mixtures and liquids. Instruments and Experimental Techniques, 45, pp. 281-284 (2002).
2. Whitenett G., Stewart G., Atherton K., Culshaw B., and Johnstone W. Optical fibre instrumentation for environmental monitoring applications. J. Opt. A: Pure Appl. Opt., 5, pp. S140-S145 (2003).
3. Qiao L., Yong X., Fukang J., Yu-Chong T., and Chih-Ming H. A Parameterized Three-Dimensional Model for MEMS Thermal Shear-Stress Sensors. J. of Microelectromechanical Systems, 14, pp. 625-633 (2005).
4. Posani K.T., Tripathi V., Annamalai S., Weisse-Bernstein N.R., and Krishnaa S. Nanoscale quantum dot infrared sensors with photonic crystal cavity, Appl. Phys. Let., 88, pp. 151104-1–151104-3 (2006).
5. Hiroyuki S., Masahiro Y., Masuyoshi Y., Nagaaki O., Hideaki T., and Takashi O. Experimental evaluation of fingerprint verification system based on double random phase encoding, Optics Express, 14, pp. 1755-1766 (2006).
6. Egorov A.A., Egorov M.A., Tsareva Yu.I., and Chekhlova T.K. Study of the integrated-optical concentration sensor for gaseous substances, Laser Physics, 17, pp. 50-53 (2007).
7. Хансперджер Р. Интегральная оптика: Теория и технология. – М.: Мир, 1985.
8. Шевченко В.В. Плавные переходы в открытых волноводах. – М.: Наука, 1969.
9. Снайдер А., Лав Дж. Теория оптических волноводов. – М.: Радио и связь, 1987.
10. Egorov A.A. Vector theory of the waveguide scattering of laser radiation in the presence of noise (Method of modes and method of the Green’s function), Laser Physics, 14, pp. 1072-1080 (2004).
11. Egorov A.A. Use of waveguide light scattering for precision measurements of the statistical parameters of irregularities of integrated optical waveguide materials, Opt. Eng., 44, pp. 014601-1–014601-10 (2005).