UDC 004.93'11
BLOOD PRESSURE RHYTHM ESTIMATION BASED ON SHAPE OF PATTERNS FOR ANALYTIC SPECTRA
V. Е. Antsiperov1, K. G. Mansurov1, V. V. Bonch-Bruevich2
1Kotel’nikov Institute of Radio Engineering and Electronics of Russian Academy of Science
2Joint Stock Company NEUROCOM
The paper is received on November 20, 2014
Abstract: The paper presents the latest results of developing new methods, based on Multiscale Correlation Analysis for bio-medical signals processing. It is shown that in case a signal has the form of repeated wave pulses, MCA naturally leads to the technique previously introduced by the authors and called the analytical spectra. It is also demonstrated, that detecting typical MCA fragments by appropriate patterns, gives the possibility to significantly improve the repetition estimation. The paper discusses the application of these methods to the problems of the blood pressure rhythm monitoring. In relation to monitoring BP some characteristics of the method are under discussion.
Key words: blood pressure monitoring, i-Medicine, third generation sensors, multiscale correlational analysis, analytic spectra.
The great progress of the modern technological innovation in the field of computer, communication and multimedia gives hope for similar impressive advances in new medical devices and instruments generation. Therefore we observe now an unprecedented growth of interest in such instrumentation, especially in compact mobile medical devices (gadgetry). Such modern tools will provide undoubtedly principally new and potentially unlimited health services to the wide range of people.
Medicine becomes now a considerably data-rich science. The power of above mentioned technologies enables us to measure and process a lot of signals, parameters and other data that characterize the patient functional status. It will significantly improve the quality of treatment, help in diagnosis and patient monitoring, and allow some patients to stay home instead of hospital bed thanks to remote monitoring possibility. It makes true the opinion of Norbert Wiener – the father of cybernetics – who wrote in [1]: "As far back as four years ago, the group of scientists and myself had already become aware of the essential unity of the set of problems centering about communication, control, and statistical mechanics, whether in the machine or in living tissue." So Wiener's vision today is reality.
After the new hardware comes the need for appropriate software, which is equally important as it helps in linking the functionality of the parts of hardware, grows over and over. It is important to outline, that it concerns not only the system software such as drivers, interfaces and utilities, but also the special purpose applications, designed for data analysis, automatic diagnostics, forecasting, interoperability scenarios, etc. It should be stressed that the most specific of special purpose applications are those, which are destined for primary processing of acquired data (digital signal processing, DSP). Specificities, special features of such processing determine the most adequate information extraction and in ultima analysi specificity of the medical device.
It should be also noted that, despite impressive progress in the development of microprocessor technology, and the expansion of programming mobile devices opportunities for the programmability of personal computers, the task of developing a robust, adequate and effective DSP algorithms and methods is still in the field of attention.
In this paper we present the latest results of developing new methods of bio-medical signals processing, based on Multiscale Correlation Analysis (MCA) [2,3]. We show that in case of signals having a form of repeated wave pulses (motives), MCA leads naturally to the technique previously introduced by the authors and called the analytical spectra (AS) [4,5]. We also demonstrate, that detecting typical MCA fragments by appropriate patterns, gives us the possibility to significantly improve the periodicity estimates. In the center of discussion is the application of these methods to the problems of the arterial blood pressure (ABP) rhythm monitoring automation.
The problem of ABP rhythm monitoring is very similar to the well-known problem of instantaneous heart rate estimation from electrocardiogram (ECG) waveforms [5], since both signals are due to the cardiac cyclic contractions. However, since ABP and ECG reflect different aspects of the cardiovascular system operating – ECG reflects the heart electrical activity, and the ABP – mechanical response to this excitation, their repeated waveforms are markedly different (see Fig.1), and therefore the estimating procedures can differ essentially.
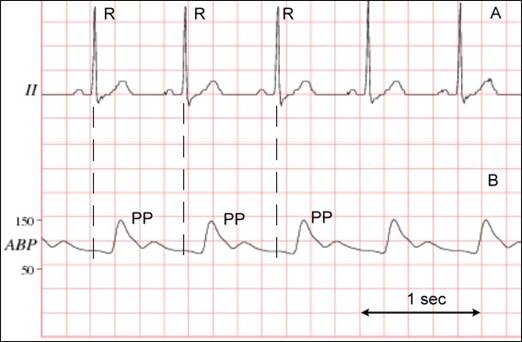
Fig.1. Normal arterial
blood pressure waveform (B) and its relation to the ECG wave (A).
Record
mimic2db/a40008 from MIMIC II Waveform DB, v2 [6]; PhysioNet ATM screenshot.
The systemic ABP waveform results from ejection of blood from the left ventricle into the aorta during systole, followed by peripheral arterial runoff of this stroke volume during diastole (Fig.1). The systolic components follow the ECG wave (with characteristic R–peak) and consist of a steep pressure upstroke, peak (PP), and decline and correspond to the period of left ventricular systolic ejection. Note that the systolic upstroke of the artery pressure trace does not appear for 120 to 180 milliseconds after inscription of the ECG R–peak. This interval reflects the sum of times required for spread of left ventricular contraction, aortic valve opening, left ventricular ejection, etc.
Thanks to such a feature of the ECG signal as sharp R–peaks (or rather whole QRS complexes), already in the early years of heart rate detection, an algorithmic structure was developed that is now shared by many algorithms [7]. As a rule it is divided into a preprocessing and rate estimation stage, including peak detection and decision logic. Due to the fact that ABP waveform does not contain as well expressed peak as ECG does, moreover, its pressure peak (PP) can often be greatly deformed (depending on measuring conditions), using algorithms similar in structure with QRS detecting generally does not bring success [8,9].
Fortunately, there are other effective approaches to solve the aforesaid problem. We have shown previously [5] that our Multiscale Correlation Analysis (MCA) method [2,3] is a very effective approach to bio-medical signal processing if it contains a set of repeating events (motives). The MCA basic tool is a symmetric estimation Rx(τ | t) of a signal two-dimensional autocorrelation function (ACF), which in the simplest case has the form:

where x is one-dimensional source signal, t – current time (the time moment under analysis), τ – variable (multi) scale. An example of multi-scale ACF (1) for a real ABP signal is shown in Fig.2.
Fig.2 clearly demonstrates that ACF (1) has side peaks corresponding to the local (for time moment t) rhythm characteristic times [3] (first peak location corresponds to rhythm period, second – to double period, etc.). So, positions of these peaks can be utilized as rhythm period estimates instead of maxima of source signal. The advantage of ACF (1) is that it can be formed on the small signal basis equal to doubled maximal scale τ, whose value can be assigned, for example, in 1.5 sec. The traditional ACF estimates usually need a much bigger signal base to avoid peaks smoothing due to the rhythm variability.
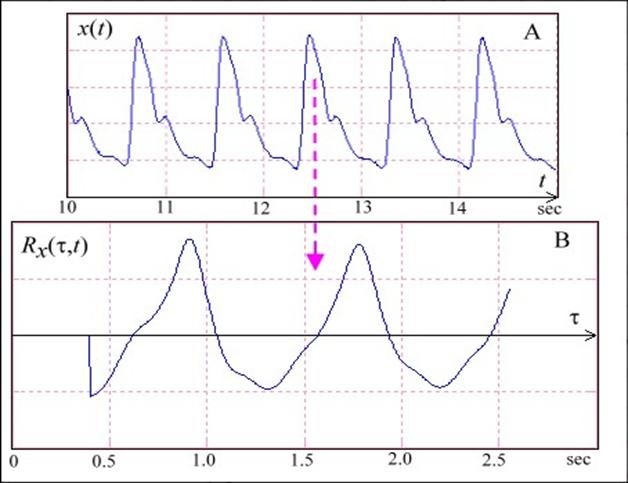
Fig.2. Real ABP signal
fragment (A) and its ACF (B) for some time moment t highlighted by
arrow
So in order to have automatically generated local period estimation, we need to determine reliably the position of ACF (1) side peaks. Our experience has shown that direct peaks detection by means of ACF maximum search is not a robust procedure because autocorrelation (1) is a multimodal function. Much more stable and reliable is the maximum detection by means of the generalized spectrum of ACF (Fig.3). Generalized spectrum G(τ|t,σ) represents the ACF decomposition in window functions (patterns) W(τ’|τ,σ) having a form of a Morlaix wavelet. In contrast to the classical wavelet analysis we consider as spectral variable window position τ instead of scale σ:

An example of ACF (1) shown on the background of spectral components {W(t’|τ,σ)} and resulting generalized spectrum G(τ|t,σ) are presented in Fig.3, (A) and (B) consequently.
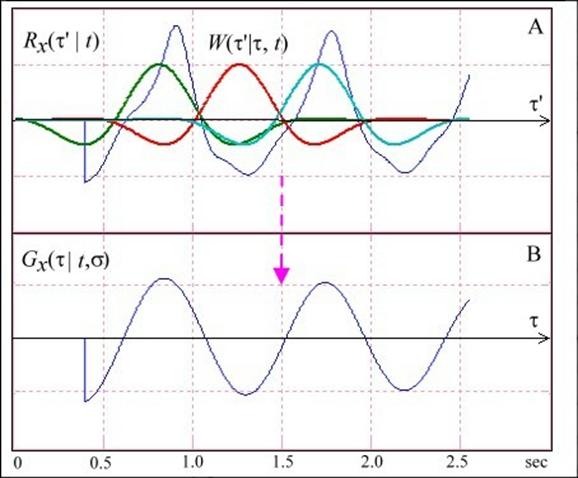
Fig.3. ACF (Fig.2) with a set of spectral windows (A) and resulting generalized spectrum (B).
Applying twice convolution theorem for the Fourier transform, it is easy in approximation τ > σ to get a different representation of the spectrum (2):
 (3)
(3)
where
 (4)
(4)
are analytic spectra (AS), introduced and discussed in [4].
Numerical realization of the spectrum computing algorithm (3) does not cause any problems. Obviously it is the inverse Fourier transform from the weighted by Gaussian window product of analytical spectra (4), which, in turn, are the result of a Fourier transform of local signal future x(t+t’) and local signal past x(t–t’) consequently. Using for Fourier transformations the fast algorithms (FFT), makes the whole procedure (3) of the spectrum computation fast as well. In addition, as mention above, the rhythm estimation on the base of generalized spectrum (3) is also robust, with good accuracy, even in a considerable noise conditions.
The authors acknowledge financial support from RFBR grant № 14-07-00496 А.
REFERENCES
1. N. Wiener. Cybernetics: or Control and Communication in the Animal and the Machine. // Paris, (Hermann & Cie) & Camb. Mass. (MIT Press) 1948.
2. V.E. Antsiperov, Y.V. Obukhov. Multiscale correlation analysis of real medical and biological signals and their graphical-based representation. // Proceedings of VIII International scientific conference "Physics and radioelectronics in medicine and ecology FRЕME’2008", 2008, Vladimir-Suzdal, Vol. 1, pp. 180-184.
3. V.E. Antsiperov. Multiscale correlation analysis of nonstationary signals containing quasi-periodic fragments. // J. of Communications Technology and Electronics Vol. 53, № 1, 2008, pp. 65-77.
4. V.E. Antsiperov. The concepts of analytic local past / future signal spectra and their use for constructing and analysis of the bilinear time-frequency representations. // Proceedings of the 16-th international conference “Digital signal processing and its applications, DSPA-2014”, 2014, Moscow, Vol.1, pp. 113-117.
5. V.Е. Antsiperov, S.A. Nikitov. Heart rate monitoring based on analytical spectra technique // Proceeding of Russian-German (until 2012 – Russian-Bavarian) conference on biomedical engineering, S.Petersburg, 2014, pp. 169-171
6. M. Saeed, M. Villarroel, A.T. Reisner, et al. Multiparameter intelligent monitoring in intensive care II (MIMIC-II): A public-access ICU database.// Critical Care Medicine, Vol. 39, № 5, 2011, pp. 952-960.
7. B-U. Kohler, C. Hennig, and R. Orglmeister. The Principles of Software QRS Detection. // IEEE Engineering in Med. and Biol., Vol. 21, 2002, pp. 42-57.
8. S. Carrasco, R. Gonzalez, et al. Comparison of the heart rate variability parameters obtained from the electrocardiogram and the blood pressure wave. // Journal of Medical Engineering & Technology, Vol. 22, № 5, 1998, pp. 195-205
9. Bing Nan Li, Ming Chui Dong, Mang I. Vai. On an automatic delineator for arterial blood pressure waveforms. //Biomedical Signal Processing and Control Vol. 21, № 1, 2010, pp. 76–81.