Log periodic Bow-Tie Antennas (LPA) Design Using the Transmission Line Model
M. Abri, H. Abri Badaoui, M. A. Belhadi, I. Kalai
Laboratoire de Télécommunications, Département de Génie Electrique
Faculté de Technologie, Université Abou-Bekr Belkaïd -Tlemcen
BP 230, Pôle Chetouane, 13000 Tlemcen- Algérie
Received June 13, 2012
Abstract. In this paper, a transmission line model is used to design log periodic of bow-tie antennas arrays operating in C band fed in series with enhanced bandwidth. The transmission line model is simple, precise and allowing taking into account the whole geometrical, electric and technological characteristics of the antennas arrays. To validate this last, the obtained simulation results are compared with those obtained by the moment’s method (MoM) of the Momentum software. Using this transmission line approach the resonant frequency, input impedance, return loss can be determined simultaneously. Agreements between transmission line model data and the moment’s methods results were achieved.
Key words : Microstrip bowtie antenna, log periodic concept, transmission line model, Moment’s method.
Аннотация. В работе исследуется применение модели двухпроводной линии при конструировании логопериодической антенной решетки. Эта модель проста, точна и позволяет учитывать геометрические, электрические и технологические характеристики антенной решетки. Результаты, полученные методом математического моделирования, сравниваются с результатами, полученными методом моментов. При использовании подхода двухпроводной линии резонансная частота, входной импеданс и потери на отражение могут быть определены одновременно. Данные, полученные этим методом и методом моментов, согласуются друг с другом.
Ключевые слова: микрополосковая антенна-бабочка, логопериодическая конструкция, модель двухпроводной линии.
I. Introduction
The printed antennas array aroused an interest growing during these last years, in particular in the mobiles communications fields and the monolithic structures, where the radiating elements and the phase-converters are integrated in the same substrate. This is mainly due to the unique feature of microstrip antennas; which are, namely, low in profile, compact in structure, light in weight, conformable to non planar surfaces, easy and inexpensive for mass production [1-3].
A printed antenna presents a weak band-width and gain, association in array of several printed antennas makes it possible to compensate the single antenna limitations characteristic and to improve their gain and radiation performances. One of the antennas disadvantages remains a narrow band-width.
The broad band systems interest is confirmed day after day. The telecommunication standards multiplication of the future terminals, the exploitation of the ultra high frequency in various fields requires the use of broad band antennas.
Various techniques have been proposed to improve the bandwidth operation of microstrip elements, such as using thicker substrates combined with very low dielectric constant materials, using parasitic elements, using impedance matching networks and using two or more electromagnetically coupled patches on top of one another or stacked [4-9]. Another successful attempt to enhance the bandwidth of microstrip antenna was made by applying the log-periodic technique to design a microstrip array.
Among the printed antennas developed during recent years are the subject of much research and development, we include the bow-tie antennas whose shape and size allow them to be integrated into modules transmit or receive.
The printed antennas characterization requires the use of software using rigorous numerical methods such as integral equations solved by the moment’s method. These we offer precision course, but they require tedious calculations. Using the transmission line model provides the best solution. One of the fundamental rules of scientific research is the validation of results. For this case, a rigorous method which is the method of moments was chosen to demonstrate the validity of the proposed model.
In the present work, an attempt was made to design a log-periodic printed antennas array (LPA) by the equivalent transmission line model, which makes it possible to take in account the whole antennas geometrical, electrical characteristics of and their feed system.
II. Transmission line model
This technique treats the radiating element as a resonant line showing no change in the transverse field. The only variation in the field is along the length of the antenna.
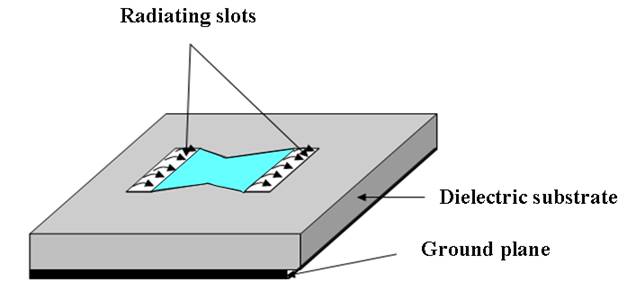
Figure 1. Transmission line model principle.
The radiation from this antenna appears at its ends that are modeled by two radiating slots, separated by a transmission line the same length as the antenna as shown in Figure 1. It is a simple method that generates a good interpretation of radiation mechanism.
The advantage of the microstrip feed is in the simple fabrication using photolithographic procedure when it is needed to supply several radiating elements instead by a coaxial probe. In our model, in the case of coaxial probe feeding, a single coaxial probe is connected directly to the antenna through a microstrip line (SMA connector). In the case of microstrip line feeding there is line of dimension (W, L) is added to the center of the antenna as shown in Figure 2 (a).
Because of edge effects, the microstrip antenna is greater than its physical dimensions. This is shown in Figure 2 (b) where the size of the antenna along its length was extended on each end by a distance ΔL, which is a function of dielectric constant and effective εreff ratio of width W on the thickness h (W1/h).
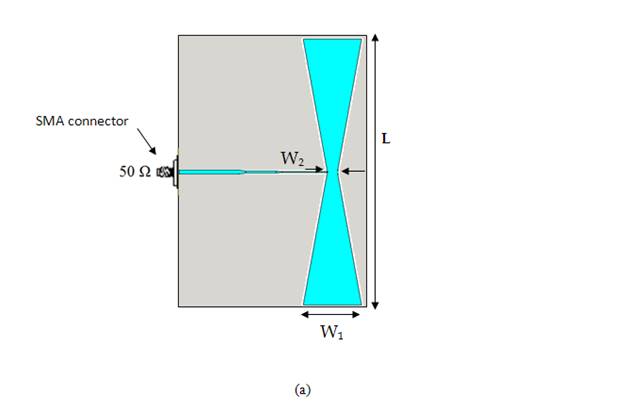
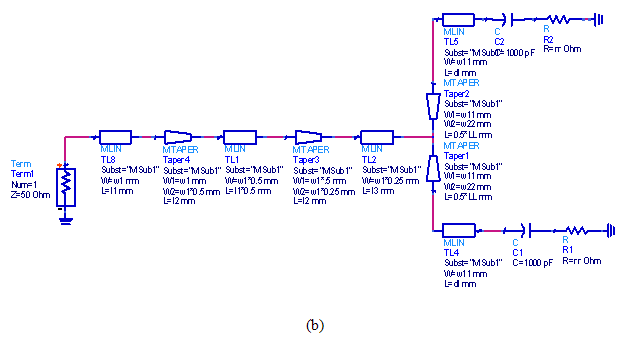
Figure 2. (a) Bow-tie Antenna the geometry fed by a microstrip line. (b) equivalent model of the proposed antenna.
III. Log periodic antennas formulation
The LPA have properties, which reproduce periodically according to the
logarithm of the frequency. They are made of radiating elements resulting
from/to each other starting from a multiplication of their dimension by a
factor![]() .
.
The design of the wideband array was based on frequency-independent
antenna principle which, when applied to a periodic structure, result in
scaling of the dimensions from period to period so that the performance is
periodic with the logarithm of frequency [10-11]. This principle was used to
design each row of the microstrip linear array of Figure 3. The patch length L,
width W and spacing between two adjacent elements were related initially to the
scale factor ![]() by:
by:
 (1)
(1)
The scale factor was chosen to overcome the disadvantage of the narrow
band performance of microstrip patches. If one multiplies all dimensions of the
array by with ![]() the element n become n+1 and
the element n+1 become the element n+2. Consequently the array will have the
same radiation properties at all the frequencies which are connected by the
scaling factor
the element n become n+1 and
the element n+1 become the element n+2. Consequently the array will have the
same radiation properties at all the frequencies which are connected by the
scaling factor![]() .
.
![]() (2)
(2)
Where:
 (3)
(3)
Where:
d is the distance between two adjacent radiating element.
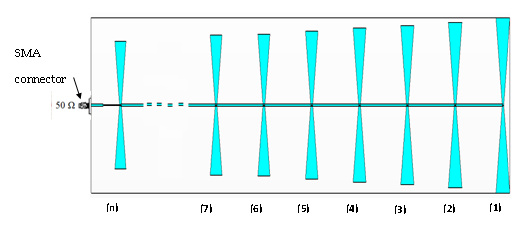
Figure 3. Log periodic antennas array architecture
To calculate the input impedance of the printed antennas array, one supposes to exploit the electric model are equivalent of each radiating element to lead to a complete electric modelling of the entire array.
The LPA equivalent circuit is presented in the following Figure 4 :
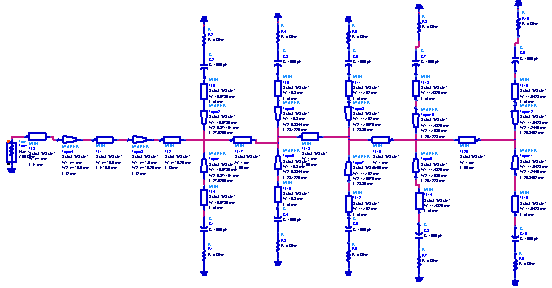
Figure 4. Equivalent circuit of the log periodic antennas array
IV. Results and discussions
The validity of the model suggested is highlighted by comparing the results of the return loss, the input phase and input impedance locus.
V. Log periodic antennas array design
This section describes the Log periodic antennas array configuration. The antennas array is to be designed on Epoxy substrate which has a relative permittivity er of 4.32, a dielectric thickness h of 1.59 mm and 0.05 mm conductor thickness and a loss tangent of about 0,048 and 0.05 mm conductor thickness. Using the transmission line model, the return loss, input impedance is analyzed in advance and its resonant frequency determined.
Using the procedure mentioned above, a linear log-periodic array with nine elements was initially designed. The resonant frequencies and dimensions of each radiating element are listed in Table 1, table 2 and table 3. The scaling factor is respectively t=1.01, 1.04 and 1.035 for the array of five, nine and eleven element.
Table 1. Bandwidth for each antenna.
|
Elements |
Freq [GHz] |
W1 [mm] |
W2 [mm] |
L [mm] |
|
1 |
5.25 |
11.64 |
1.24 |
29.84 |
|
2 |
5.35 |
11.43 |
1.16 |
29.12 |
|
3 |
5.45 |
11.10 |
1.10 |
28.35 |
|
4 |
5.55 |
10.80 |
0.88 |
28.12 |
|
5 |
5.65 |
10.57 |
0.87 |
27.52 |
Table 2. Bandwidth for each antenna
|
Elements |
Freq [GHz] |
W1 [mm] |
W2 [mm] |
L [mm] |
|
1 |
4.30 |
14.68 |
1.50 |
37.371 |
|
2 |
4.47 |
14.25 |
1.79 |
35.31 |
|
3 |
4.65 |
13.83 |
1.88 |
33.90 |
|
4 |
4.82 |
13.43 |
1.88 |
32.74 |
|
5 |
5.00 |
13.03 |
1.97 |
31.38 |
|
6 |
5.17 |
12.65 |
1.96 |
30.31 |
|
7 |
5.35 |
12.29 |
1.78 |
29.79 |
|
8 |
5.52 |
11.93 |
1.93 |
28.35 |
|
9 |
5.70 |
11.58 |
1.97 |
27.26 |
Table 3. Bandwidth for each antenna
|
Elements |
Freq [GHz] |
W1 [mm] |
W2 [mm] |
L [mm] |
|
1 |
4.25 |
14.82 |
1.51 |
37.75 |
|
2 |
4.40 |
14.39 |
1.65 |
36.12 |
|
3 |
4.55 |
13.97 |
1.65 |
34.91 |
|
4 |
4.70 |
13.56 |
1.51 |
34.19 |
|
5 |
4.85 |
13.17 |
1.40 |
33.37 |
|
6 |
5.00 |
12.79 |
1.55 |
31.87 |
|
7 |
5.15 |
12.41 |
1.55 |
30.81 |
|
8 |
5.30 |
12.05 |
1.52 |
29.87 |
|
9 |
5.45 |
11.70 |
1.45 |
29.07 |
|
10 |
5.60 |
11.36 |
1.45 |
28.10 |
|
11 |
5.75 |
11.03 |
1.28 |
27.63 |
The results of the various antennas array in terms of reflection coefficient are shown in Figure 5
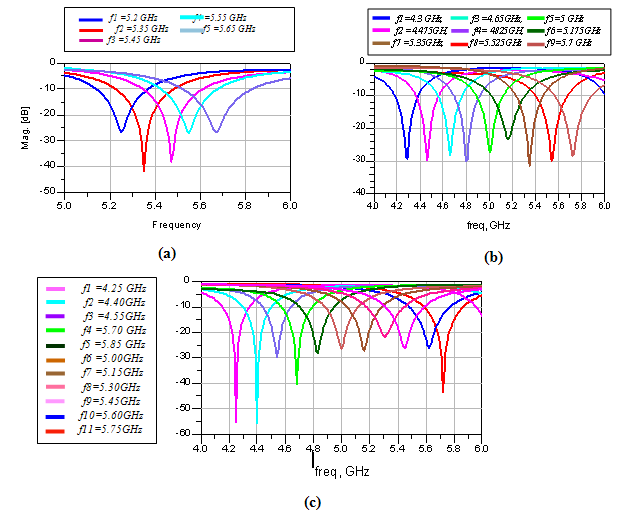
Figure 5. Reflection coefficient at the input of each antenna. (a) five antennas are used, (b) nine antennas are used, (c) eleven antennas are used.
In the following tables we present the computed return losses of different antennas array.
Table 4. Different pics of each antenna. Five elements are used in this case.
|
Elements |
Frequency [GHz] |
Return losses [dB] |
|
1 |
5.25 |
-26.46 |
|
2 |
5.35 |
-41.62 |
|
3 |
5.45 |
-38.09 |
|
4 |
5.55 |
-26.92 |
|
5 |
5.65 |
-26.62 |
Table 5. Different pics of each antenna. Nine elements are used in this case.
|
Elements |
Frequency [GHz] |
Return losses [dB] |
|
1 |
4.300 |
-29.25 |
|
2 |
4.475 |
-29.71 |
|
3 |
4.650 |
-28.29 |
|
4 |
4.825 |
-30.00 |
|
5 |
5.000 |
-27.37 |
|
6 |
5.175 |
-23.30 |
|
7 |
5.350 |
-31.64 |
|
8 |
5.525 |
-30.00 |
|
9 |
5.700 |
-30.00 |
Table 6. Different pics of each antenna. Eleven elements are used in this case.
|
Elements |
Frequency [GHz] |
Return losses [dB] |
|
1 |
4.25 |
-55.40 |
|
2 |
4.4 |
-55.70 |
|
3 |
4.55 |
-29.64 |
|
4 |
4.70 |
-40.00 |
|
5 |
4.85 |
-28.28 |
|
6 |
5.00 |
-26.48 |
|
7 |
5.15 |
-27.32 |
|
8 |
5.30 |
-21.59 |
|
9 |
5.45 |
-25.90 |
|
10 |
5.60 |
-25.93 |
|
11 |
5.75 |
-43.28 |
The return losses presented in Table 4, 5 and 6 shows an amplitude less than -23.30 dB at the resonance frequency for each antenna, which means that these antennas have a perfect matching.
The bandwidths obtained for respectively 5, 9 and 11 elements of the antennas array are summarized in Table 7, 8 and 9.
Table 7. Computed bandwidth for each antenna of the antennas array of five elements.
|
Element |
bandwidth [MHz] |
|
1 |
230 |
|
2 |
260 |
|
3 |
270 |
|
4 |
260 |
|
5 |
310 |
Table 8. Computed bandwidth for each antenna of the antennas array of nine elements.
|
Element |
Bandwidth [MHz] |
|
1 |
210 |
|
2 |
200 |
|
3 |
220 |
|
4 |
230 |
|
5 |
230 |
|
6 |
290 |
|
7 |
240 |
|
8 |
280 |
|
9 |
320 |
Table 9. Computed bandwidth for each antenna of the antennas array of nine elements.
|
Element |
Bandwidth [MHz] |
|
1 |
200 |
|
2 |
210 |
|
3 |
200 |
|
4 |
220 |
|
5 |
250 |
|
6 |
240 |
|
7 |
260 |
|
8 |
280 |
|
9 |
280 |
|
10 |
290 |
|
11 |
280 |
Because the input impedance of a patch at its edges is usually too high for direct connection to the feeding line, whose standard impedance is 50 Ohm. A quarter wave transformer can be designed to achieve a satisfactory return loss at the resonant frequency. The size of the antennas array is respectively 59.6 mm× 256.6, 438 mm×74,5 mm and 535 mm ×74,5 mm, and their inter-element spacing is approximately lg/2. The antennas array architectures are shown in the Figure 6.
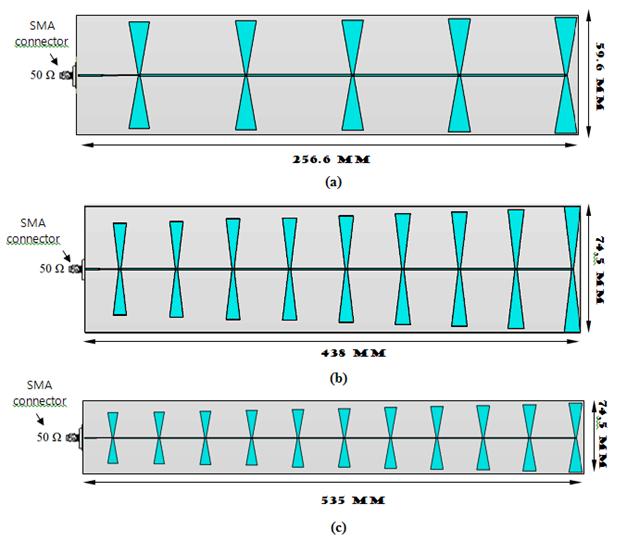
Figure 6. The mask layout with dimensions of bow-tie antennas array. (a) array with five antennas, (b) array with nine antennas, (c) array with eleven antennas.
In Figure 7 we provide the simulated input antenna return loss. A comparison has been made between the transmission line model and the moment method of the Momentum software. According to the result obtained on the below figure, we notice that there is a perfect match between the two models and a good matching, the curves in a good agreement.
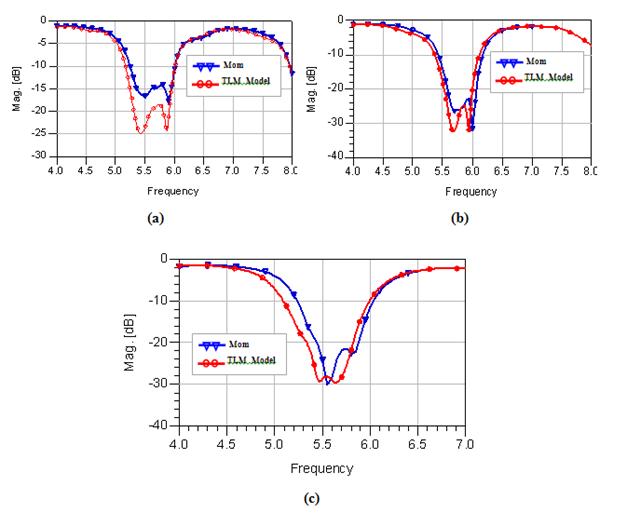
Figure 7. The antennas array computed return losses. (a) array composed of 5 antennas, (b) array composed of 9 antennas, (c) array composed of 11 antennas.
The simulated antennas array input VSWR is displayed for frequencies between 4.0 to 8.0 GHz in Figure 8.
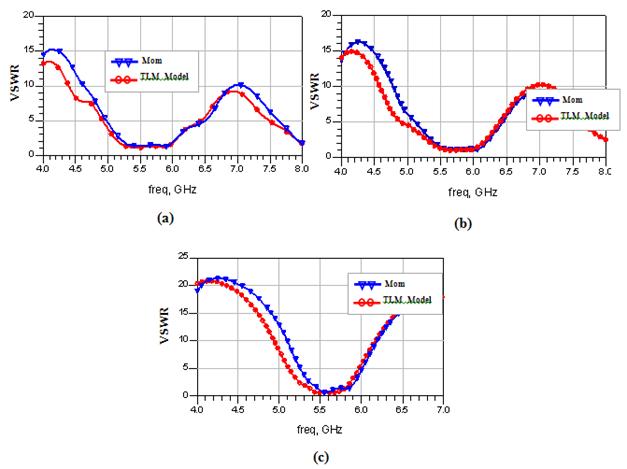
Figure 8. Simulated input antennas array VSWR. (a) array composed of 5 antennas, (b) array composed of 9 antennas, (c) array composed of 11 antennas.
According to the result shown in Figure 8, we see an excellent agreement between the two models (the transmission line model and the moment’s method), this justifies the validity of our model. The VSWR level at resonant frequency is near unity, which implies an ideal adaptation of the antennas array. The simulation result on the reflected phase at the input of the antennas array is shown in Figure 9.
One notices very well that the phase is null by the two models in spite of the slight shift observed. The impedance locus of the antennas array from 4.0 to 8.0 GHz is illustrated on Smith's chart in Figure 10.
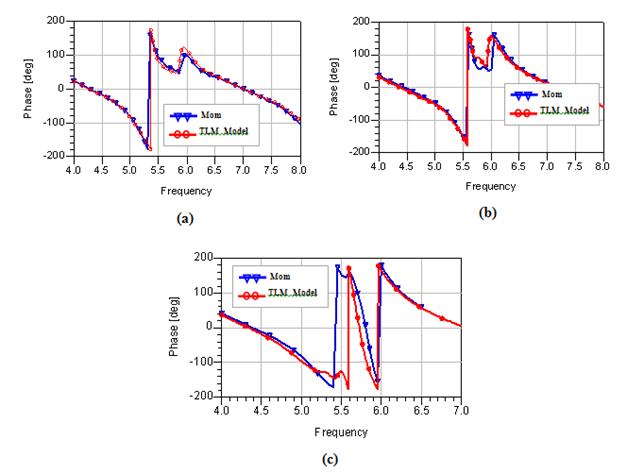
Figure 9. Computed reflected phase of return losses. (a) array composed of 5 antennas, (b) array composed of 9 antennas, (c) array composed of 11 antennas.
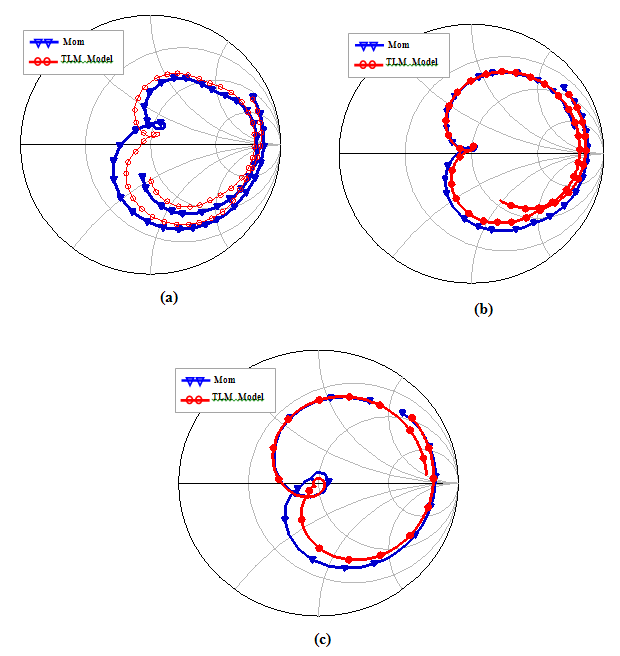
Figure 10. Smith's chart of the input impedance return losses. Frequency points given by start = 4.0 GHz, stop = 8.0 GHz.
The input impedance or the antennas array has been calculated over a frequency range of 4.0-8.0 GHz. It can be seen from Fig. 10 that the comparison for the input impedance between transmission line model and the moment method results are in good agreement. One notices that the resonant frequency is very close to the axis of 50 Ohm.
The bandwidth obtained from the antennas array is summarized in fig. 11.
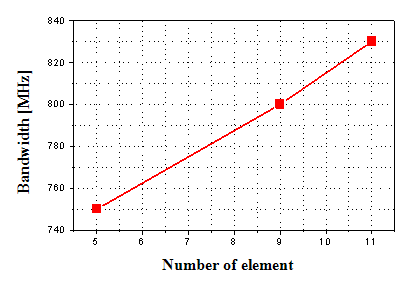
Figure 11. The bandwidth obtained from the antennas array.
We notice an improvement in the bandwidth, which is about 750 MHz, 800 MHz and 830 MHz respectively for five, nine and eleven in comparison with single element. The proposed technique proves its effectiveness in enhancing the bandwidth.
VI. Conclusion
A flexible and computation-efficient transmission line model is developed to design log periodic of bow-tie antennas array. Even though the model is conceptually simple, it still produces accurate results in a relatively short period of computing time. Using the log periodic concept the bandwidth is clearly enhance and reached the value 830 MHz in the case of an array composed of nine elements for wide-band application.
The results obtained highlighted an excellent agreement between the transmission line model and the moment’s method.
REFERENCES
[1] M. Abri, N. Boukli-hacene et F. T. Bendimerad, « Application du Recuit Simulé à la Synthèse des Réseaux d’Antennes Imprimées en forme d’anneaux » Annales des télécommunications, 60, N°11-12, pp. 1424-1440, 2005.
[2] M. Abri, N. Boukli-hacene, F. T. Bendimerad and E. Cambiaggio, “ Design of a Dual Band Ring Printed Antennas Array”, Microwave journal, vol. 49, no. 5, pp. 228-232, May. 2006.
[3] M. Abri, N. Boukli-hacene and F. T. Bendimerad, “Ring printed antennas arrays radiation. Application to multibeam“., Mediterranean Microwave Symposium, Marseille, France, June 2004.
[4] X. X. Zhang, Q. Song. A study on wideband gap-coupled microstrip antenna arrays. IEEE Trans Antennas Propag. 1995, 43:313–317.
[5] A. Hongming, K. J. C. Nauwelaers,A. R. Van de Chapelle. Broadband active microstrip antenna design with the simplified real frequency technique. IEEE Trans Antennas Propag. 1994, 42:1612–1619.
[6] R. Q. Lee, K. F. Lee. Experimental study of the two-layer electromagnetically coupled rectangular patch antenna. IEEE Trans Antennas Propag. 1990, 38:1298–1302.
[7] Z. Liu, P. Kooi, L. Mook-Seng. A method for designing broad-band microstrip antennas in multilayered planar structures. IEEE Trans Antennas Propag. 1999, 47:1416–1420.
[8] H. Legay, L. Shfal. New stacked microstrip antenna with large bandwidth and high gain. IEE Proc, 1994, H141:199–204.
[9] C. A. Balanis. Antenna Theory Analysis and Design, Second Edition. United States of America. John Wiley & Sons 1997, p734.
[10] M. K. Rahim. A and P. Gardner. The design of Nine Element Quasi Microstrip Log-periodic Antenna. IEEE RF and Microwave Conference 2004, 5 -6 October 2004, pp. 132- 135.
[11] M. K. Rahim, M. R. Ahmad, A. Asrokin and Z. A. A Aziz. 'The Design of UWB antenna using log Periodic Technique. Loughbrough Antennas and Propagation Conference (LAPC 2006), 2nd - 3rd April 2006, Loughbrough, U.K.