![]()
To ensure a very high accuracy of zero approximation the
CDFs of the test-statistic ![]() were constructed for a
5-element antenna array with 5, 10 and 15 samples, by means
of numerical simulation experiment and the suggested
approximation method. Figure 1 shows the CDFs calculated on
the base of zero approximation (
were constructed for a
5-element antenna array with 5, 10 and 15 samples, by means
of numerical simulation experiment and the suggested
approximation method. Figure 1 shows the CDFs calculated on
the base of zero approximation (![]() -dashed curves)
and the experimental
CDFs based on 100,000 random realizations (
-dashed curves)
and the experimental
CDFs based on 100,000 random realizations (![]() -solid curves). As seen
in Figure 1a, in a linear scale the curves are practically
indistinguishable. Representation of data in a logarithmic
scale (see Figure 1b) allows to estimate the high accuracy
of the zero approximations of the CDFs. The detailed
investigation of the CDF approximation accuracy
was carried out by numerical simulation for various numbers
-solid curves). As seen
in Figure 1a, in a linear scale the curves are practically
indistinguishable. Representation of data in a logarithmic
scale (see Figure 1b) allows to estimate the high accuracy
of the zero approximations of the CDFs. The detailed
investigation of the CDF approximation accuracy
was carried out by numerical simulation for various numbers
![]() of terms in the expansion 13.
Figure 2 depicts the absolute errors of the CDF approximation
of terms in the expansion 13.
Figure 2 depicts the absolute errors of the CDF approximation
![]() for the 5-element
antenna array with number of samples
for the 5-element
antenna array with number of samples ![]() .
.
![]()
![]()
![]()
By comparison of Figure 1 and Figure 2, it is seen that
the zero approximation allow the evaluation of the CDFs with
the absolute accuracy ![]() in the whole
definition interval [0,1].
in the whole
definition interval [0,1].
The threshold ![]() calculation accuracy of the suggested approximation
method was investigated too. Firstly, on the experimental CDF
calculation accuracy of the suggested approximation
method was investigated too. Firstly, on the experimental CDF
![]() the threshold values
the threshold values ![]() of the test-statistic
of the test-statistic
![]() for the given probabilities of false alarm
for the given probabilities of false alarm
![]() had been found. Then, for this threshold values
had been found. Then, for this threshold values ![]() the false alarm probabilities
the false alarm probabilities ![]() were
analytically calculated by employing the approximating
series 13 of various lengths
were
analytically calculated by employing the approximating
series 13 of various lengths
![]() .
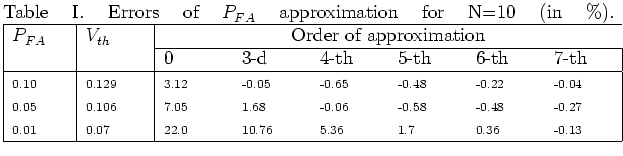
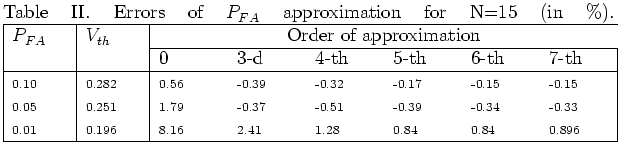
The errors of false alarm probability approximation
.
The errors of false alarm probability approximation
![]() are represented in the
two tables (Table I for
are represented in the
two tables (Table I for ![]() and Table II for
and Table II for ![]() ) placed below.
By comparing these two tables, it is seen that errors of approximation
decrease as the number of samples N increases.
) placed below.
By comparing these two tables, it is seen that errors of approximation
decrease as the number of samples N increases.
For the worst case ![]() , it is seen (from Table I) that the zero approximation allows to determine
, it is seen (from Table I) that the zero approximation allows to determine ![]() with an accuracy better then
with an accuracy better then ![]() . The using of the approximating series 13 with four terms (taking into account four test-statistic moments) and six terms (taking into account six test-statistic moments) allows to calculate
. The using of the approximating series 13 with four terms (taking into account four test-statistic moments) and six terms (taking into account six test-statistic moments) allows to calculate ![]() with accuracy better then
with accuracy better then ![]() and
and ![]() respectively.
respectively.